Ներողություն ենք խնդրում կայքի մեքենայական թարգմանության հնարավոր սխալների համար
3.1.E. Հողի և ծառերի կենսաբեռի ածխածնի պահեստավորում
Աշխարհագրական տեղեկատվական համակարգերի վերլուծություն – Վարդան Ասատրյան (ՀՀ ԳԱԱ)
Արդյունքների ներկայացում – Ելենա Բուկվարևա (BCC-Հայաստան);
Հողի գնահատումը ածխածնի պաշարները կազմվել են՝ օգտագործելով տվյալների Աշխարհի հողեր՝ 250 միլիոն օրգանական ածխածնի պաշարներ Տվյալների հավաքածու։ Ծառերի կենսաբեռում առկա ածխածնի պաշարը գնահատվել է՝ օգտագործելով ESRI-ի (2023) տրամադրած ծառածածկույթի մակերեսը և փայտի միջին ածխածնի պարունակությունը։ Ըստ Ակոպյան կենտրոնի, Վանաձոր քաղաքի (Հյուսիս-արևելյան Հայաստան) մոտակայքում գտնվող անտառներում անցկացված փորձնական ուսումնասիրությունը ցույց է տվել 98 տոննա ածխածին/հեկտար արժեք։ Այնուամենայնիվ, տվյալները Աշխարհի անտառների վիճակը, FAO, 2011 Հայաստանի կենդանի անտառային կենսազանգվածի ընդհանուր ածխածնի պաշարը գնահատվում է 13 միլիոն տոննա, միջինը 48 տԿ/հա ամբողջ երկրում: Մենք այս միջինն օգտագործել ենք մեր հաշվարկներում: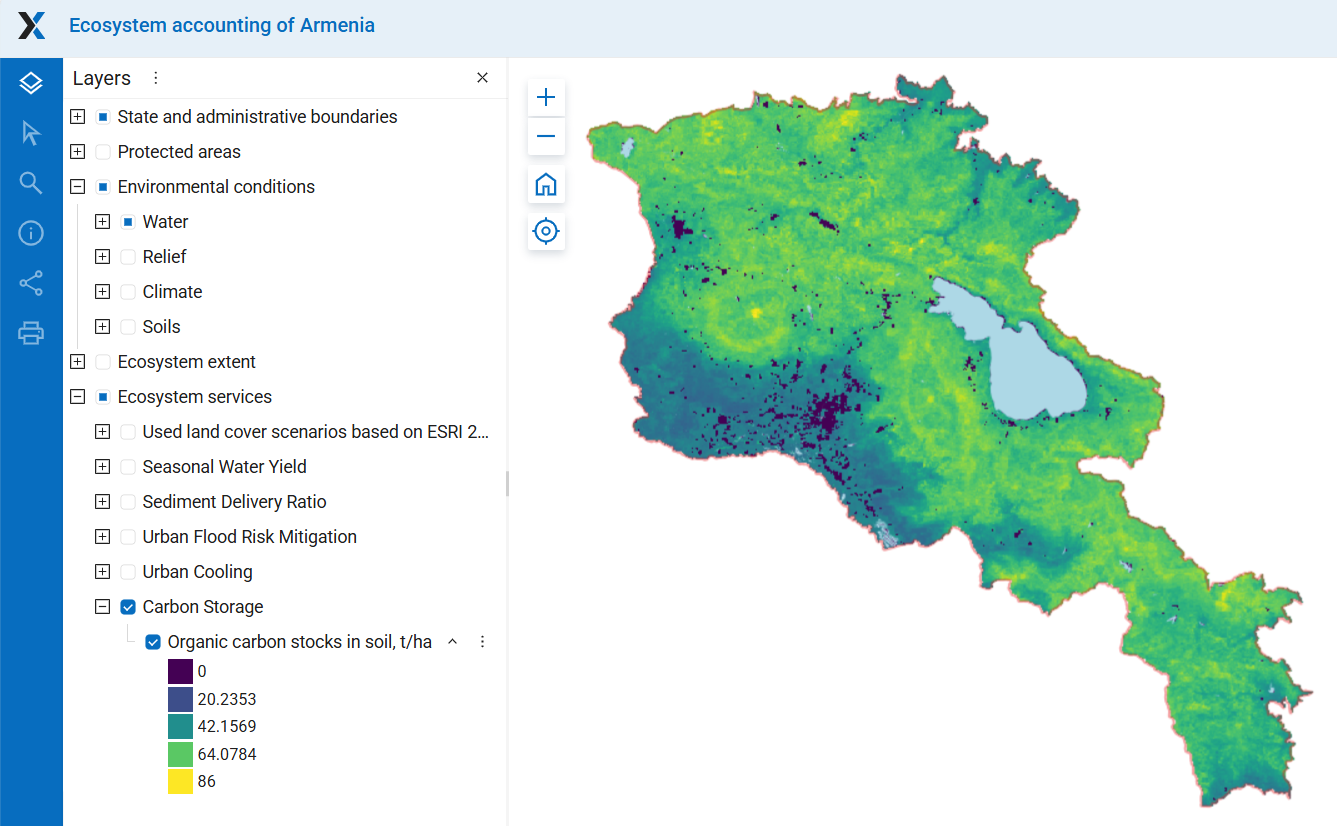
Նկ. 31E-1. Հողի ածխածնի պաշարներ, տ/հա; մանրամասների համար տես վեբ-ԳԻՍ նախագիծ, էկոհամակարգային ծառայությունների բաժին
Արմենիայում ածխածնի պաշարները՝ ըստ մարզերի և բուսական գոտիների
Հողի մեջ ածխածնի միջին պարունակությունը տարբեր մարզերում տատանվում է 62-ից մինչև 32 տ/հա և բուսականության գոտիներ (Բաժին 2.3) 64-ից մինչև 29 տոննա ածխածին/հեկտար։ Հայաստանի 0-30 սմ խորության հողերում ընդհանուր ածխածնի պաշարը կազմում է 158.4 ՄտC, իսկ ծառային կենսաբեռնում՝ 15 ՄտC (2023 թվականին)։ Հողերում և ծառերի կենսաբեռնում ընդհանուր ածխածնի պաշարը կազմում է 173 ՄտС։ Հաշվի առնելով, որ Ադրբեջանում անտառային տարածքը համեմատաբար փոքր է, հիմնական ածխածնի պաշարը (91,41 TP3T) պահվում է հողերում։
30 սմ հողի շերտում ածխածնի պարունակությունը մեծ մասամբ մարզերում կազմում է 52–61 տ/հա, իսկ Արմավիրում և Արարատում այն ցածր է (32 և 44 տ/հա համապատասխանաբար)՝ ածխածնային աղքատ կիսաանապատային հողերի պատճառով (Նկ. 31E-2 a): Ընդհանուր ածխածնի պաշարը առավելագույնն է Սյունիքի, Լոռու և Գեղարքունիքի մարզերում (25–28 ՄտC), իսկ ամենացածրը՝ Արմավիրի մարզում (4 ՄտC), հողի ածխածնի ցածր պարունակության և էկոհամակարգերի փոքր տարածքի պատճառով (Աղյուսակ 31E-1; Նկ. 31E-2 b): Ծառային կենսաբեռի ածխածնի պաշարը նկատելի ավելացում է հողի ածխածնին միայն Տավուշի և Լոռու մարզերում:
«World Soils 250 m Organic Carbon Stocks» տվյալների հավաքածուի համաձայն՝ հողի ածխածնի պարունակությունը առավելագույն է լեռնային խոտածածկ գոտիներում (64 տ C/հա) և անտառային ու ստեփային գոտիներում (57–59 տ C/հա): Ածխածնի ամենացածր պարունակությունը հանդիպում է անապատային և կիսաանապատային հողերում (29–35 տ C/հա) (Աղյուսակ 31E-2; Նկ. 31E): Հողի ածխածնի պաշարը առավելագույնն է ստեփե, անտառային և ենթալպյան գոտիներում, իսկ ամենացածրը՝ ջունիպերի գոտում՝ դրա սահմանափակ տարածքի պատճառով: Ընդհանուր ածխածնի պաշարը առավելագույնն է անտառային գոտում՝ ծառային կենսաբեռի զգալի ներդրման շնորհիվ:
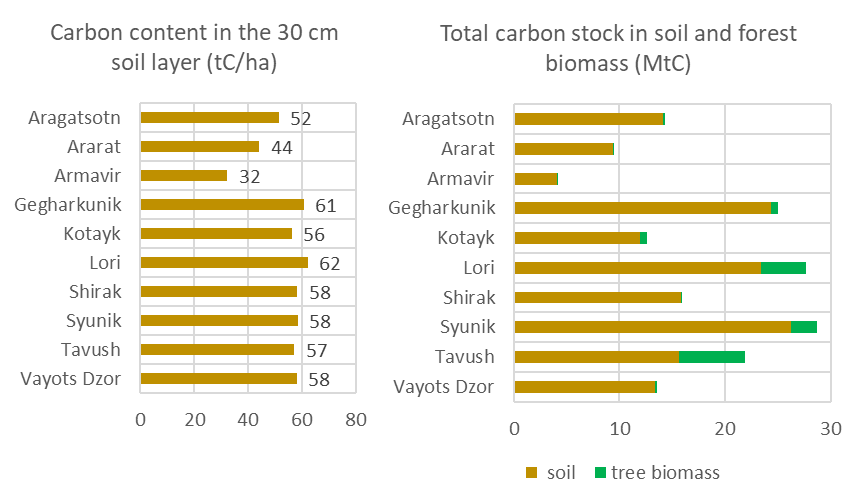
Նկ. 31E-2. Ածխածնի պաշարները մարզերում՝ ա) Ածխածնի պարունակությունը 30 սմ հողի շերտում, tС/հա; բ) Հողի և ծառերի կենսաբեռնումների ածխածնի պաշարը, ՄտС Գեղարքունիքի մարզի տարածքը հաշվարկվում է՝ բացառելով Սևան լիճը։
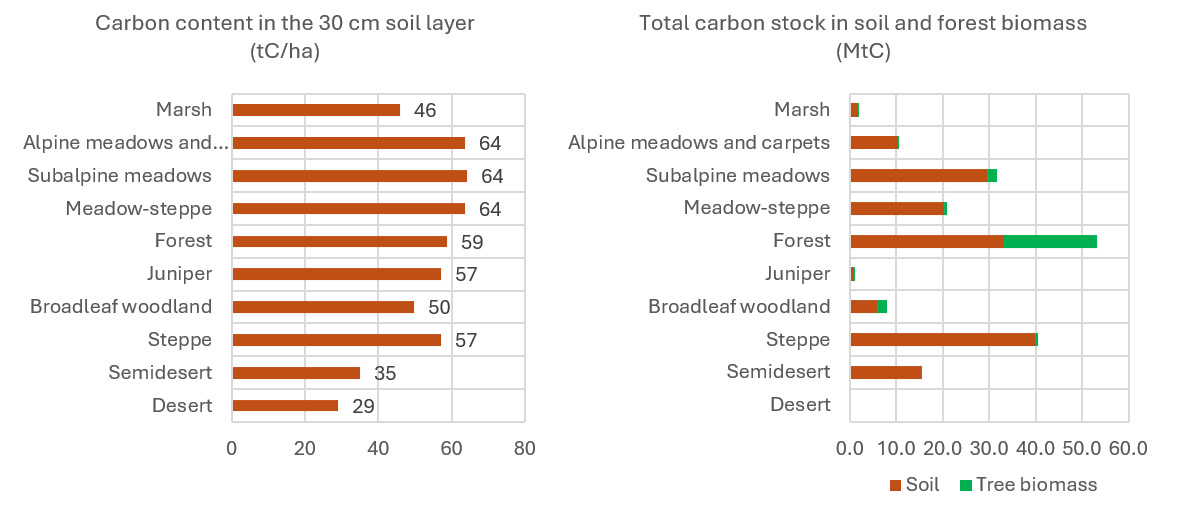
Նկ. 31E-2. Ածխածնի պաշարները բուսածածկույթի գոտիներում: ա) ածխածնի պարունակությունը 30 սմ հողի շերտում, տ/հա; բ) հողի և ծառերի կենսաբեռի ածխածնի պաշար, ՄտC
Ծառերի կենսազանգվածում ածխածնի պաշարների փոփոխությունները 2017-ից 2023 թվականներին
Ածխածնի պաշարի փոփոխությունները գնահատվել են ծառածածկույթի մակերեսի փոփոխությունների հիման վրա՝ օգտագործելով ESRI տվյալները։ Մարզերի մասով ամենամեծ բացարձակ նվազումը արձանագրվել է Սյունիքում, իսկ ամենամեծ հարաբերական նվազումը՝ Արմավիրի մարզում (Աղյուսակ 31E-1; Նկար 31E-3): Բուսական գոտիներում պաշարները նվազել են բոլոր գոտիներում՝ բացառությամբ անապատի (որտեղ չկա փայտածուխային բուսականություն) և լայնատերև անտառների։ Ամենամեծ նվազումը գրանցվել է անտառային գոտում; սակայն 2017 թվականի համեմատ այն կազմել է ընդամենը 41 TP3T (աղյուսակ 31E-2; նկ. 31E-4)։ Նկ. 31E-3. 2017–2023 թթ. ընթացքում մարզերում ծառերի կենսաբեռի ածխածնի պաշարի փոփոխություններ՝ ա) ածխածնի պաշարի փոփոխություններ, ՄտՑ; բ) 2017 թվականի նկատմամբ ածխածնի պաշարի փոփոխություններ, 1 տոննա պղնձի համար մեկ տոննա փայտանյութի հաշվարկով։
Նկ. 31E-4. 2017–2023 թթ. ընթացքում ծառերի կենսաբեռնում ածխածնի պաշարի փոփոխությունները բուսածածկույթի գոտիներում՝ ա) ածխածնի պաշարի փոփոխություններ, ՄտC; բ) 2017 թվականի նկատմամբ ածխածնի պաշարի փոփոխություններ, %
Աղյուսակ 31E-1. Մարզերում ածխածնի պաշարը և դրա փոփոխությունները 2017–2023 թվականներին
| Մարզ | 30 սմ հողի շերտում միջին ածխածնի պարունակությունը (տC/հա) | Տարածքը (առանց Սևանա լճի), հա | Ածխածնի պաշար հողում, MtC | Ծառերի մակերես, ESRI 2017, հա | Ծառերի մակերես, ESRI 2023, հա | Ծառերի կենսազանգվածում ածխածնի պաշար, 2017, MtC | Ծառերի կենսազանգվածում ածխածնի պաշար, 2023, MtC | Հողի և ծառերի կենսազանգվածում ածխածնի ընդհանուր պաշարը, 2023, MtC | Ծառերի կենսազանգվածում ածխածնի պաշարների փոփոխությունները 2017-ից 2023 թվականներին | |
| ՄՏԿ | % համեմատ 2017 թ | |||||||||
| Արագածոտն | 52 | 273612 | 14.10 | 5254 | 4825 | 0.25 | 0.23 | 14.34 | -0.02 | -8.2 |
| Արարատ | 44 | 211491 | 9.37 | 3047 | 2620 | 0.15 | 0.13 | 9.50 | -0.02 | -14.0 |
| Արմավիր | 32 | 126370 | 4.10 | 284 | 55 | 0.01 | 0.00 | 4.10 | -0.01 | -80.5 |
| Գեղարքունիք | 61 | 397392 | 24.14 | 13493 | 12956 | 0.65 | 0.62 | 25.01 | -0.03 | -4.0 |
| Կոտայք | 56 | 211480 | 11.90 | 17174 | 15310 | 0.82 | 0.73 | 12.63 | -0.09 | -10.9 |
| Լոռի | 62 | 376300 | 23.41 | 86951 | 88374 | 4.17 | 4.24 | 27.65 | 0.07 | 1.6 |
| Շիրակ | 58 | 271863 | 15.87 | 1308 | 1343 | 0.06 | 0.06 | 15.93 | 0.00 | 2.6 |
| Սյունիք | 58 | 449335 | 26.27 | 63426 | 50774 | 3.04 | 2.44 | 28.71 | -0.61 | -19.9 |
| Տավուշ | 57 | 272624 | 15.60 | 130410 | 131633 | 6.26 | 6.32 | 21.92 | 0.06 | 0.9 |
| Վայոց ձոր | 58 | 229654 | 13.36 | 4710 | 3813 | 0.23 | 0.18 | 13.54 | -0.04 | -19.0 |
| Բոլոր մարզերը | 56 | 2820122 | 158.11 | 326059 | 311701 | 15.65 | 14.96 | 173.32 | -0.69 | -4.6 |
Աղյուսակ 31E-2. Բուսական գոտիներում ածխածնի պաշարը և դրա փոփոխությունները 2017–2023 թվականներին
| Ածխածնի պարունակությունը 30 սմ հողի շերտում (տC/հա) | Տարածք, հա | Ածխածնի պաշար հողում, MtC | Ծառերի մակերես, ESRI 2017, հա | Ծառերի մակերես, ESRI 2023, հա | Ծառերի կենսազանգվածում ածխածնի պաշար, 2017, MtC | Ծառերի կենսազանգվածում ածխածնի պաշար, 2023, MtC | Հողի և ծառերի կենսազանգվածում ածխածնի ընդհանուր պաշարը, 2023, MtC | Ծառերի կենսազանգվածում ածխածնի պաշարների փոփոխությունները 2017-ից 2023 թվականներին, MtC | Ծառերի կենսազանգվածում ածխածնի պաշարների փոփոխությունները 2017-ից 2023 թվականներին՝ %՝ 2017 թվականի համեմատ | |
| Մարշ | 45.9 | 39055 | 1.79 | 246.8 | 146.6 | 0.01 | 0.01 | 0.02 | -0.005 | -40.6 |
| Ալպիական մարգագետիններ և գորգեր | 63.6 | 163794 | 10.42 | 588.6 | 106.4 | 0.03 | 0.01 | 0.03 | -0.023 | -81.9 |
| Ենթալպյան մարգագետիններ | 64.2 | 460885 | 29.60 | 51282.2 | 43987.0 | 2.46 | 2.11 | 4.57 | -0.350 | -14.2 |
| Մարգագետնատափաստան | 63.6 | 318335 | 20.26 | 13415.2 | 13327.4 | 0.64 | 0.64 | 1.28 | -0.004 | -0.7 |
| Անտառ | 58.7 | 564380 | 33.14 | 432710.2 | 416416.2 | 20.77 | 19.99 | 40.76 | -0.782 | -3.8 |
| Գիհի | 57.2 | 13560 | 0.78 | 901.2 | 720.7 | 0.04 | 0.03 | 0.08 | -0.009 | -20.0 |
| Լայնատերեւ անտառ | 49.8 | 117317 | 5.84 | 43015.7 | 46096.8 | 2.06 | 2.21 | 4.28 | 0.148 | 7.2 |
| Տափաստանային | 57.1 | 696619 | 39.78 | 18417.5 | 16405.2 | 0.88 | 0.79 | 1.67 | -0.097 | -10.9 |
| Կիսաանապատ | 35.0 | 437940 | 15.32 | 1137.1 | 602.9 | 0.05 | 0.03 | 0.08 | -0.026 | -47.0 |
| Անապատ | 29.1 | 752 | 0.02 | 0.0 | 0.0 | 0 | 0 | 0.00 | 0.000 | 0 |