Ներողություն ենք խնդրում կայքի մեքենայական թարգմանության հնարավոր սխալների համար
2.2. Հողածածկույթի դասերի տարածվածությունը Հայաստանում
Աշխարհագրական տեղեկատվական համակարգերի մոդելավորում և վերլուծություն – Էդուարդ Կազակով (NextGIS OÜ, Էստոնիա)
Արդյունքների վերլուծություն և ներկայացում – Ելենա Բուկվարևա (ԲԿԿ-Հայաստան)
Կառավարական տվյալների որոնում – Արմեն Գրիգորյան (BCC Armenia)
2.2.A. Հողածածկույթի դասերի տարածությունը, որոնք ներկայացվել են Հայաստանի կառավարության կողմից
2019 թ. ապրիլի 11-ի Արմենիայի Հանրապետության կառավարության թիվ 431-Ն որոշմամբ «Արմենիայի Հանրապետության հողածածկույթի դասակարգման ընթացակարգի հաստատման մասին» ազգային հաշվառման համար սահմանվել են հետևյալ հողածածկույթի դասերը՝
– Մշակվող հողեր
– Ճահճավայրեր
– Ծառերով ծածկված տարածքներ
– թփուտապատ տարածքներ
– Ջրով ծածկված տարածքներ
– Անբուսական տարածքներ
Աղյուսակ 1. Արցախի Հանրապետության հողածածկույթը՝ 2974258.8 հա տարածքով, ըստ դասերի, 2020-2024 թթ.
| Ցամաքային տարածքի ծածկույթի դաս | 2020 թ հուլիսի 1-ի դրությամբ | 2021 թ հուլիսի 1-ի դրությամբ | 2023 թ հուլիսի 1-ի դրությամբ | 2023 թ հուլիսի 1-ի դրությամբ | 2024 թ հուլիսի 1-ի դրությամբ |
| Մշակովի հողեր | 538361.22 | 538580.09 | 538930.12 | 538919.19 | 539620.52 |
| Խոտածածկավայրեր | 1366386.896 | 1371066.28 | 1370749.11 | 1370618.62 | 1363686.44 |
| Ծառածածկ տարածքների | 400522.06 | 400375.84 | 400279.49 | 382109.06 | 382361.15 |
| Թփուտապատ տարածքների | 34200.612 | 34193.77 | 34135.56 | 34124.48 | 34374.33 |
| Ջրածածկ տարածքների | 151491.8 | 153889.698 | 153890.39 | 172088.29 | 172117.81 |
| Բուսականությունից զուրկ տարածքների | 483295.83 | 476152.342 | 476274.17 | 476398.959 | 482098.73 |
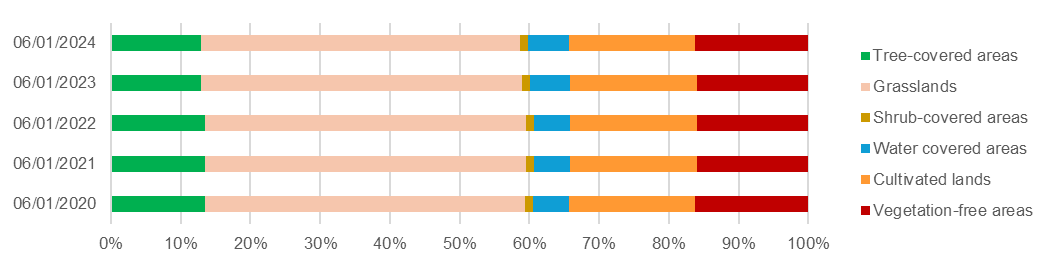
Նկար 1. Հողածածկույթի դասերի բաժինը Արմենիայում՝ կառավարության ներկայացրած տվյալներով
Այս տվյալները բավարար են SEEA EA-ի առաջարկած ձևաչափով հաշվարկային աղյուսակը միայն մասամբ լրացնելու համար (Աղյուսակ 2), քանի որ առկա են միայն սկզբնական և վերջնական ծավալների տվյալները (տողեր 1 և 9): Այս տվյալների հիման վրա հաշվարկվում է տարածքների զուտ փոփոխությունը (տող 8): Հողային ծածկույթի դասերի տարածքների ընդհանուր ընդլայնման և կրճատման տվյալները, որոնք կարող են փոխհատուցել միմյանց (2-րդ և 5-րդ տողեր), ինչպես նաև փոփոխության շարժիչ ուժերի բաժանումը կառավարվող և չկառավարվող (3-րդ, 4-րդ և 6-րդ, 7-րդ տողեր) տվյալները հասանելի չեն։
Աղյուսակ 2. Հողածածկույթի դասերի տարածքի հաշվարկային աղյուսակը 2020 և 2024 թվականների համար՝ հիմնված կառավարության հաղորդած տվյալների վրա։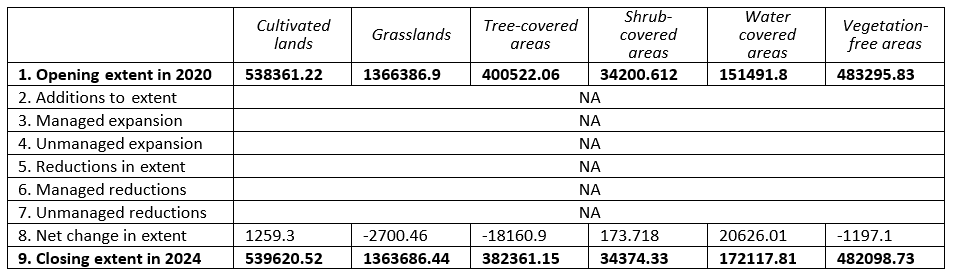
Կառավարության ներկայացրած տվյալներում հողային ֆոնդի կատեգորիաներով հողածածկույթի դասերի ավելի մանրամասն տարանջատումը թույլ է տալիս առանձնացնել բուսածածկույթից զուրկ անթրոպոգեն՝ այսինքն՝ կառուցապատված տարածքները բնական տարածքներից և հնարավորություն է տալիս համեմատել կառավարական տվյալներն ու հողածածկույթի տվյալների հավաքածուները (տես այստեղ). Արդյունքը՝ վերակարգավորված բուսածածկույթից զերծ տարածքներով՝ Արմենիայի և մարզերի մասշտաբով, ցուցադրված է 2-րդ նկարում։
Բնակավայրերի սահմանների ներսում գտնվող արոտավայրերի և մշակվող հողերի դասակարգման հարցը պետք է լուծվի՝ արբանյակային հիմքով հողածածկույթի դասակարգումները պաշտոնական հողածածկույթի վիճակագրության հետ համադրելու համար։ Վերլուծության այս փուլում մենք այդ հողերը համապատասխանաբար դասակարգել ենք արոտավայրերի և մշակվող հողերի մեջ։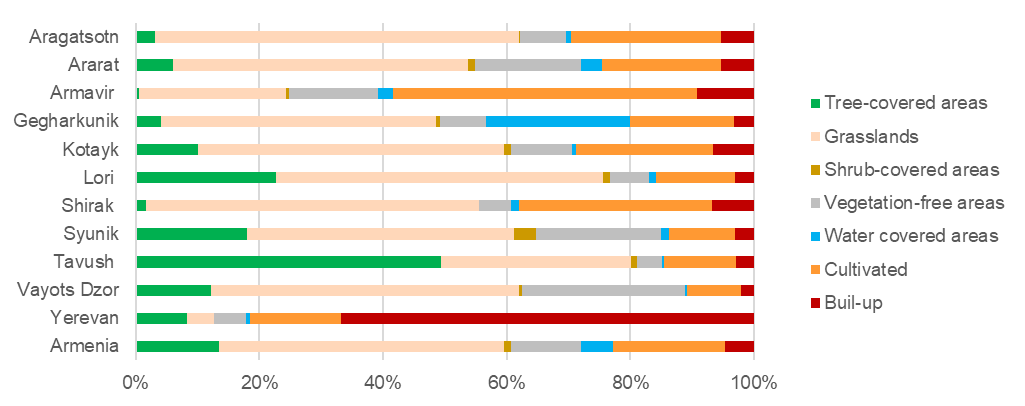
Նկար 2. Հողածածկույթի դասերի բաժինը Արմենիայում և մարզերում՝ կառավարության ներկայացրած տվյալներով
Աղյուսակ 3. 2022 թվականի դրությամբ մարզերով հողածածկույթի դասերի տարածքը, ըստ կառավարության ներկայացրած տվյալների, հեկտարներով
| Ծառածածկ տարածքների | Խոտածածկավայրեր | Թփուտապատ տարածքների | Բուսականությունից զուրկ տարածքների | Ջրածածկ տարածքների | Մշակված | Կառուցում | |
| Արագածոտն | 8571.9 | 163313.3 | 392.5 | 20565.3 | 2189.9 | 67143.7 | 15095.6 |
| Արարատ | 12724.74 | 99272.39 | 2496.22 | 35572.84 | 7090.2 | 40224.09 | 11061.98 |
| Արմավիր | 582.41 | 29283.57 | 634.13 | 17666.4 | 3010.438 | 60572.6 | 11345.59 |
| Գեղարքունիք | 21889.88 | 238054.4 | 3635.07 | 39933.93 | 124010.7 | 90318.54 | 17289.28 |
| Կոտայք | 20810.43 | 102757.6 | 2313.48 | 20405.93 | 1661.12 | 45813.84 | 13820.73 |
| Լոռի | 86365.8 | 200387.6 | 4830.7 | 23510.69 | 4751.58 | 48300.81 | 11717.3 |
| Շիրակ | 4598.8 | 144403.9 | 0 | 13622.23 | 3427.13 | 83846.24 | 18128.89 |
| Սյունիք | 80905.01 | 194761.5 | 15742.25 | 91253.96 | 5576.07 | 47958 | 14345 |
| Տավուշ | 133659.9 | 82690.46 | 2943.31 | 10681.01 | 1094.24 | 31359.26 | 7970.77 |
| Վայոց ձոր | 28325.5 | 114823.3 | 1147.9 | 60825.9 | 923.4 | 20109.42 | 4857.7 |
| Երևան | 1845.1 | 1001.2 | 0 | 1133.29 | 155.61 | 3283.62 | 14909.08 |
| Հայաստան | 400279.5 | 1370749 | 34135.56 | 335171.5 | 153890.4 | 538930.1 | 140541.9 |
Աղբյուրներ:
(2021) http://www.irtek.am/DOCUMENTS/PDF/148034_havelvac.pdf
(2021) https://faolex.fao.org/docs/pdf/arm209550.pdf
(2022) http://www.irtek.am/views/act.aspx?aid=156501
(2022) https://www.arlis.am/DocumentView.aspx?DocID=171671
(2023) https://www.e-draft.am/projects/6427/about
(2024) https://www.e-draft.am/projects/7902/about
2.2.B. ESRI տվյալներով հողածածկույթի դասերի տարածվածությունը
Քանի որ Նախագծում օգտագործելու համար ընտրվել է ESRI-ի հողածածկույթի տվյալների հավաքածուն։ Հաջորդ տարածական գնահատումը իրականացվել է ESRI տվյալների հիման վրա՝ մեկ պիքսելի (100 մ) տարածքի համար։2. Մյուս տվյալների հավաքակների համաձայն տարբեր հողածածկույթի դասերի տարածվածության չափը կարելի է գտնել այստեղՍևան լճի տարածքը և Երևանի վարչական տարածքը բացառվել են տարածքի գնահատումից։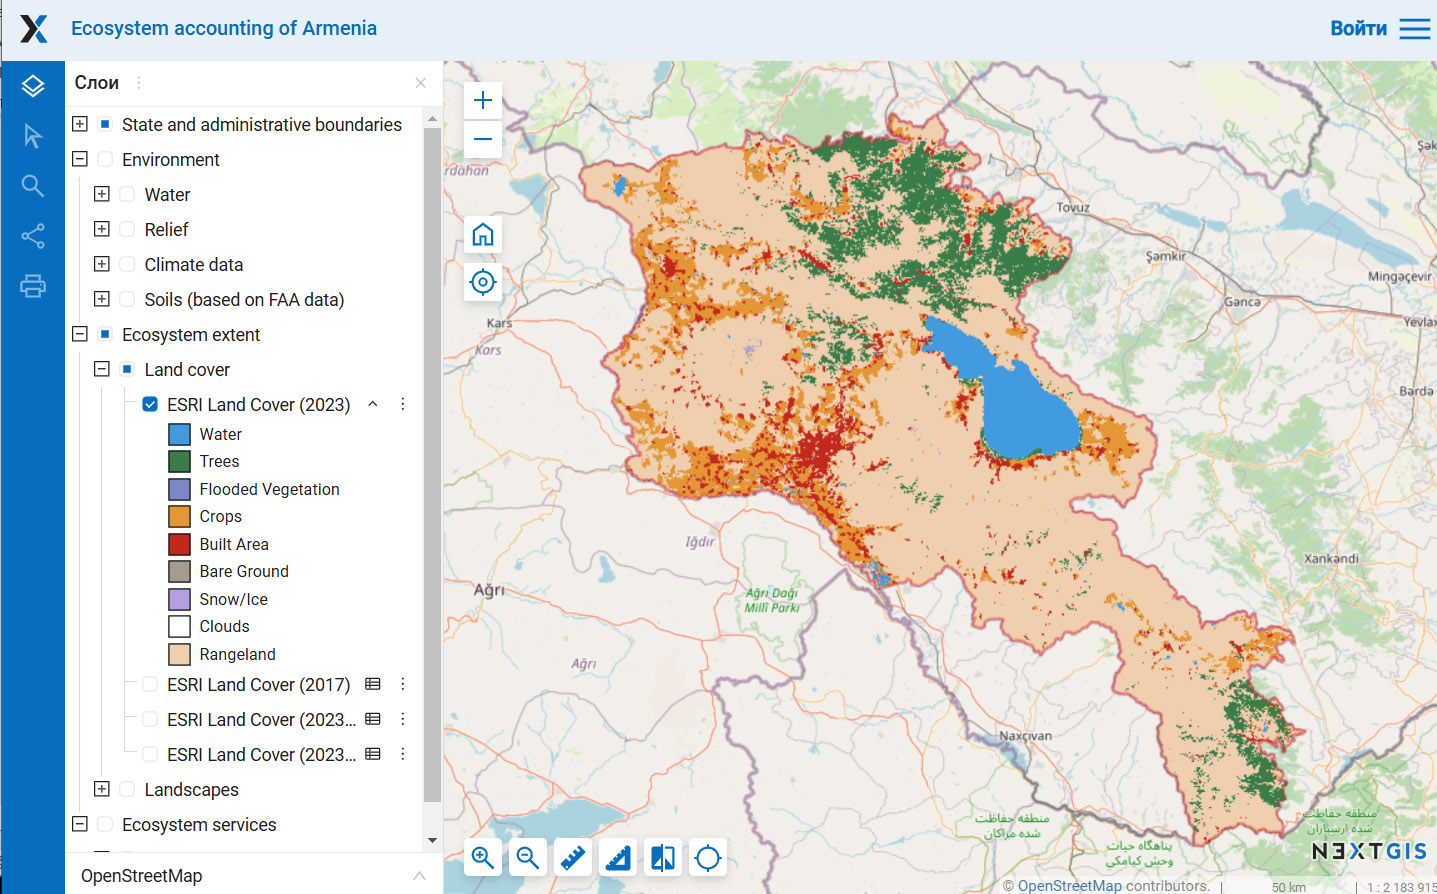
Նկար 3. ESRI տվյալների հավաքածու՝ Հայաստանի տարածքի համար. Մանրամասն քարտեզների համար տես «Էկոհամակարգի տարածք – Երկրի ծածկույթ» բաժինները այստեղ։
Հողածածկույթի դասերի տարածվածության աստիճանը ազգային, մարզային և ջրբաժանային մակարդակներում
Հայաստանի տարածքի մեծ մասը ծածկված է խոտածածկով (68%՝ ըստ ESRI տվյալների), անտառները զբաղեցնում են 11% (13%՝ ըստ կառավարության տվյալների), մշակաբույսերի հողատարածքները և կառուցապատված տարածքները կազմում են համապատասխանաբար 12% և 5%։ Մարդու կողմից առավել վերափոխված մարզը Արմավիրն է, որտեղ հացահատիկային հողերն ու կառուցապատված տարածքները միասին կազմում են տարածքի ավելի քան 60%-ը։ Ամենաքիչ վերափոխված մարզերն են Վայոց Ձորը, Տավուշը և Սյունիքը։ Անտառները ամենամեծ տարածքը զբաղեցնում են Տավուշում (մոտ 50%), և լայնորեն տարածված են նաև Լոռիում, որտեղ դրանք գերազանցում են տարածքի 20%-ը։
Աղյուսակ 4. 2017 թ. հողածածկույթի դասերի տարածքները, կմ2
| Rangeland | Ծառեր | Մերկ հող | Ձյուն/Սառույց | Հեղեղված բուսականություն | Ջուր | Մշակաբույսեր | Կառուցված տարածք | Ընդամենը | |
| ԱՐԱԳԱԾՈՏՆ | 2,161.08 | 52.54 | 12.60 | 0.02 | 0.00 | 3.43 | 380.13 | 126.33 | 2,736.12 |
| ԱՐԱՐԱՏ | 1,522.66 | 30.47 | 16.35 | 0.01 | 11.71 | 29.16 | 359.92 | 144.64 | 2,114.91 |
| ԱՐՄԱՎԻՐ | 455.53 | 2.84 | 5.45 | 0.00 | 1.81 | 6.67 | 645.14 | 146.25 | 1,263.70 |
| ԳԵՂԱՐՔՈՒՆԻՔ | 3,320.37 | 134.93 | 19.08 | 0.04 | 1.40 | 1,274.09 | 315.10 | 182.98 | 5,248.00 |
| ԿՈՏԱՅՔ | 1,506.57 | 171.74 | 7.47 | 0.74 | 0.01 | 2.49 | 270.63 | 155.14 | 2,114.80 |
| ԼՈՌԻ | 2,558.39 | 869.51 | 4.55 | 0.02 | 0.44 | 2.64 | 189.21 | 138.24 | 3,763.00 |
| ՇԻՐԱԿ | 1,998.79 | 13.08 | 4.31 | 0.00 | 0.07 | 27.21 | 537.55 | 137.61 | 2,718.63 |
| ՍՅՈՒՆԻՔ | 3,571.06 | 634.26 | 33.14 | 0.13 | 0.04 | 17.98 | 170.64 | 66.09 | 4,493.35 |
| ՏԱՎՈՒՇ | 1,234.28 | 1,304.10 | 1.34 | 0.00 | 0.00 | 4.00 | 91.52 | 91.00 | 2,726.24 |
| ՎԱՅՈՑ ՁՈՐ | 2,157.65 | 47.10 | 14.01 | 0.02 | 0.01 | 2.76 | 35.26 | 39.74 | 2,296.54 |
| ՀԱՅԱՍՏԱՆ | 20,549.27 | 3,261.03 | 119.68 | 0.97 | 15.47 | 1,371.25 | 3,018.23 | 1,372.59 | 29,708.49 |
Աղյուսակ 5. Հողածածկույթի դասերի տարածք, 2023 թ., քմ
| Rangeland | Ծառեր | Մերկ հող | Ձյուն/Սառույց | Հեղեղված բուսականություն | Ջուր | Մշակաբույսեր | Կառուցված տարածք | Ընդամենը | |
| ԱՐԱԳԱԾՈՏՆ | 2,096.86 | 48.25 | 3.48 | 6.38 | 0.00 | 3.50 | 438.49 | 139.17 | 2,736.12 |
| ԱՐԱՐԱՏ | 1,560.01 | 26.20 | 6.94 | 0.04 | 6.74 | 32.42 | 305.46 | 177.10 | 2,114.91 |
| ԱՐՄԱՎԻՐ | 461.83 | 0.55 | 2.05 | 0.00 | 0.15 | 7.10 | 609.26 | 182.76 | 1,263.70 |
| ԳԵՂԱՐՔՈՒՆԻՔ | 3,239.85 | 129.56 | 4.28 | 0.94 | 0.65 | 1,274.08 | 404.99 | 193.66 | 5,248.00 |
| ԿՈՏԱՅՔ | 1,508.64 | 153.10 | 1.08 | 1.60 | 0.00 | 2.57 | 265.38 | 182.43 | 2,114.80 |
| ԼՈՌԻ | 2,424.92 | 883.74 | 2.83 | 0.31 | 0.79 | 3.81 | 298.87 | 147.73 | 3,763.00 |
| ՇԻՐԱԿ | 1,784.67 | 13.43 | 0.91 | 2.47 | 0.00 | 31.48 | 742.89 | 142.79 | 2,718.63 |
| ՍՅՈՒՆԻՔ | 3,650.25 | 507.74 | 12.65 | 0.09 | 0.02 | 15.86 | 233.22 | 73.53 | 4,493.35 |
| ՏԱՎՈՒՇ | 1,227.75 | 1,316.33 | 0.05 | 0.04 | 0.02 | 4.35 | 82.03 | 95.67 | 2,726.24 |
| ՎԱՅՈՑ ՁՈՐ | 2,174.55 | 38.13 | 2.51 | 0.35 | 0.00 | 2.35 | 33.28 | 45.37 | 2,296.54 |
| ՀԱՅԱՍՏԱՆ | 20,185.02 | 3,117.51 | 37.33 | 12.21 | 8.39 | 1,378.29 | 3,422.08 | 1,547.66 | 29,708.49 |
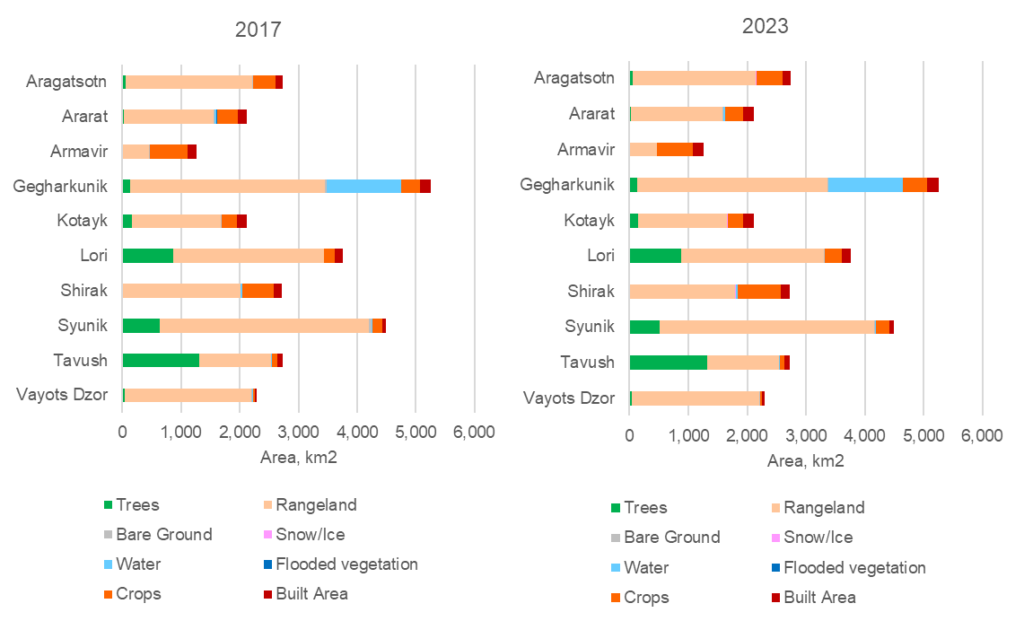
Նկար 4. Երկրի ծածկույթի դասերի տարածքները մարզերում՝ 2017 և 2023 թվականներին, կմ²
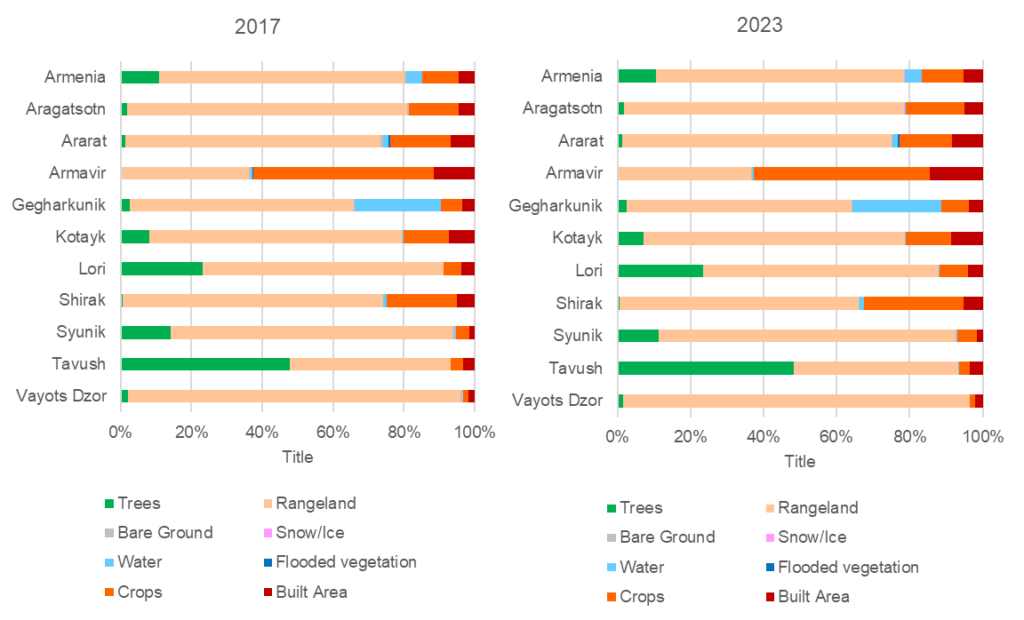
Նկար 5. Հողածածկույթի դասերի տարածքի բաժինը Արմենիայում և մարզերում 2017 և 2023 թվականներին, %
Մեծ ջրբաժանների համար նույնպես իրականացվել է հողածածկույթի դասերի տարածքի հաշվարկը, քանի որ էկոհամակարգային հաշվառման հիմնական նպատակներից մեկը ջրակարգավորող էկոհամակարգային ծառայությունների գնահատումն է, որոնք մոդելավորվում են ջրբաժանների մակարդակով։ Քանի որ Արմենիայում ջրբաժանների սահմանները մեծապես համընկնում են մարզերի սահմանների հետ (Հրազդան, Մեծամոր և Արփա ջրբաժանները յուրաքանչյուրը ընդգրկում են երկու մարզ), հողածածկույթի դասերի տարածքի բաշխման և 2017–2023 թվականների փոփոխությունների օրինաչափությունը արտացոլում է մարզային մակարդակում արձանագրված պատկերը։
Մարդու կողմից առավել վերափոխված ջրբաժաններն են Մեծամորը (Արագածոտնի և Արմավիրի մարզեր) և Ախուրյանը (Շիրակի մարզ), որտեղ մշակվող հողատարածքներն ու կառուցապատված տարածքները միասին կազմում են տարածքի մոտ 30%-ը։ Ամենաքիչ փոփոխված ջրբաժաններն են Աղստևը (Տավուշի մարզ) և Վորոտանը (Սյունիքի մարզ): անտառները ծածկում են մեծ տարածքներ Աղստևի ջրբաժանում (Տավուշի մարզ) և Դեբեդի ջրբաժանում (Լոռի մարզ):
Աղյուսակ 6. Հողածածկույթի դասերի տարածք, կմ2
| Rangeland | Ծառեր | Մերկ հող | Ձյուն/Սառույց | Հեղեղված բուսականություն | Ջուր | Մշակաբույսեր | Կառուցված տարածք | ||
| 2017 | Աղստեւ | 1600.07 | 1401.27 | 1.99 | 0.01 | 0.00 | 3.70 | 69.63 | 98.72 |
| Ախուրյանը | 1999.78 | 9.30 | 4.42 | 0.00 | 0.07 | 27.25 | 599.85 | 144.59 | |
| Արփա | 3839.27 | 79.92 | 30.63 | 0.15 | 10.84 | 26.36 | 288.32 | 134.83 | |
| Դեբեդ | 2719.90 | 843.51 | 4.83 | 0.02 | 0.44 | 3.11 | 212.89 | 141.05 | |
| Հրազդան | 4384.18 | 243.39 | 27.42 | 0.65 | 1.68 | 1281.05 | 765.19 | 545.57 | |
| Մեծամոր | 2420.53 | 49.32 | 17.31 | 0.02 | 2.41 | 11.80 | 911.62 | 241.75 | |
| Որոտան | 3573.45 | 634.26 | 32.93 | 0.13 | 0.04 | 17.98 | 170.65 | 66.09 | |
| 2023 | Աղստեւ | 1590.30 | 1397.07 | 0.09 | 0.08 | 0.02 | 4.04 | 80.02 | 103.76 |
| Ախուրյանը | 1801.94 | 9.54 | 0.90 | 2.36 | 0.00 | 31.54 | 789.01 | 149.95 | |
| Արփա | 3890.99 | 66.30 | 9.26 | 0.73 | 6.22 | 29.55 | 249.59 | 157.67 | |
| Դեբեդ | 2575.47 | 865.33 | 2.84 | 0.27 | 0.79 | 4.29 | 325.58 | 151.17 | |
| Հրազդան | 4305.51 | 228.70 | 6.24 | 2.17 | 0.67 | 1280.73 | 794.73 | 630.37 | |
| Մեծամոր | 2356.44 | 42.74 | 5.25 | 6.48 | 0.66 | 12.27 | 949.72 | 281.20 | |
| Որոտան | 3652.35 | 507.74 | 12.65 | 0.11 | 0.02 | 15.86 | 233.26 | 73.54 |
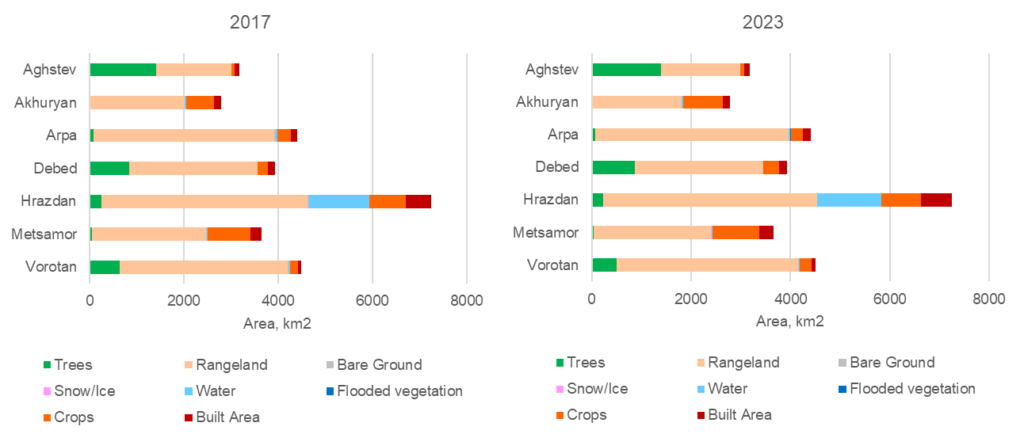
Նկար 7. Հողածածկույթի դասերի տարածքները ջրահավաք ավազաններում, 2017 և 2023 թթ., կմ²
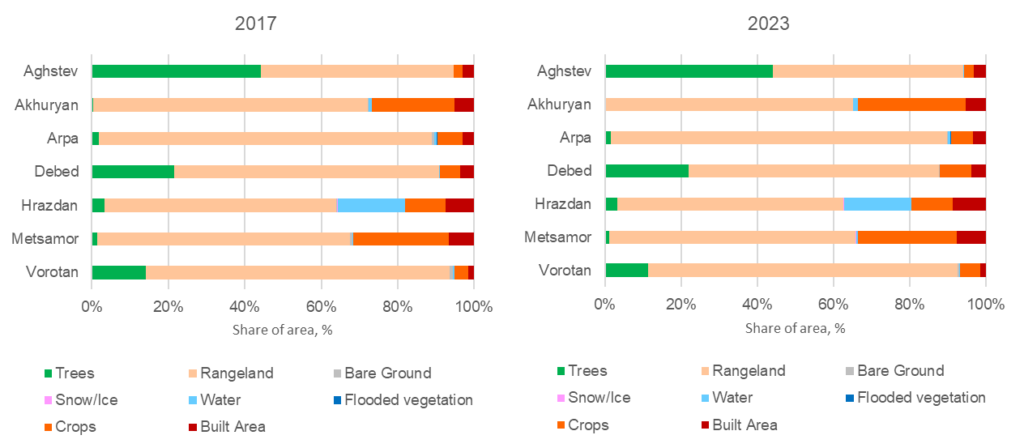
Նկար 8. Հողածածկույթի դասերի տարածքի բաժինը ջրահավաք ավազաններում 2017 և 2023 թվականներին, %
Հողածածկույթի դասի տարածքի փոփոխություններ
2017–2023 թվականներին, ըստ ESRI տվյալների, Արմենիայում մշակվող հողերի և կառուցապատված տարածքների մակերեսը համապատասխանաբար աճել է 417 կմ²-ով և 175 կմ²-ով, իսկ անտառների և արոտավայրերի մակերեսը նվազել է համապատասխանաբար 139 կմ²-ով և 383 կմ²-ով։ Այս տարիների ընթացքում բնական հողածածկույթի տեսակների ընդհանուր մակերեսը նվազել է 578,9 կմ²-ով (երկրի ընդհանուր մակերեսի 1,951 TP3T), փոխակերպվելով մշակաբույսերի հողատարածքների և կառուցապատված տարածքների։ 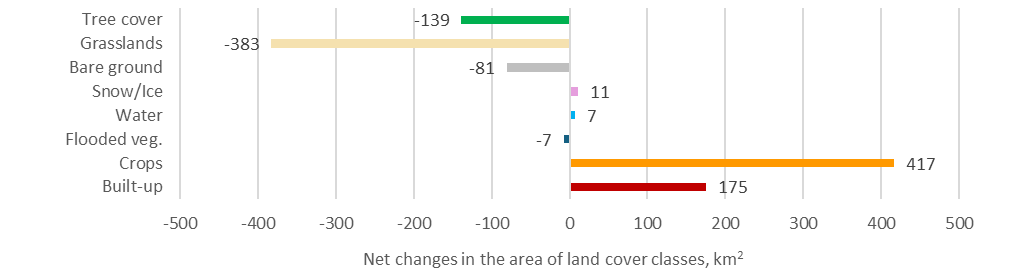
Նկար 9. Երկրի ծածկույթի դասերի մակերեսի փոփոխությունները 2017-ից մինչև 2023 թվականը
Հողի ծածկույթի փոփոխությունների քարտեզը (Նկ. 10) ցույց է տալիս, որ կառուցապատված տարածքները հիմնականում ընդարձակվել են Արարատյան հովտում և Երևանի շրջակայքում (մարուն գույն), իսկ մշակաբույսերի ցանքատարածքները առավել ինտենսիվորեն ընդարձակվել են երկրի հյուսիս-արևմուտքում (Նկ. 10-ում նարնջագույն գույն): Հյուսիս-արևելյան անտառային գոտում մի շարք վայրերում տեղական անտառների ընդլայնում է գրանցվել, սակայն ընդհանուր անտառածածկույթը նվազել է, հիմնականում Սյունիքում արոտավայրերի վերածվելու պատճառով։ Արոտավայրերը ընդլայնվել են Սյունիքի մարզի հարավային մասում, սակայն ամբողջ Արմենիայում դրանց ընդհանուր տարածքը նույնպես նվազել է՝ հողատարածքների մշակաբույսերի դաշտերի վերածվելու հետևանքով։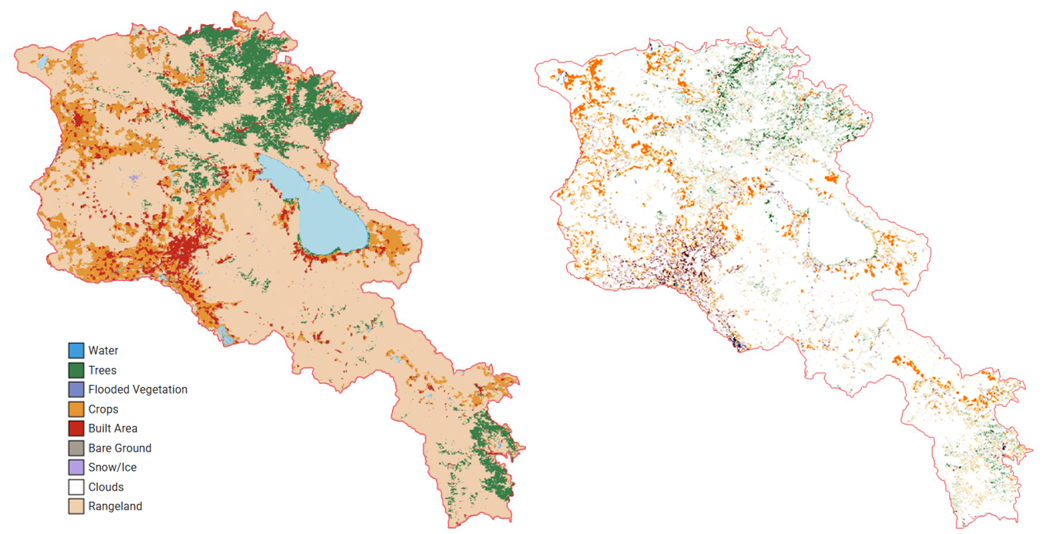
Նկ. 10. Հողի ծածկույթը և դրա փոփոխությունները: ա) ESRI-ի հողի ծածկույթի տվյալները 2023 թվականի համար; բ) 2017 թվականից ի վեր տեղի ունեցած հողի ծածկույթի փոփոխությունները, մասնավորապես նախորդ դասերի փոխարեն առաջացած նոր դասերը, ցուցադրված են։
Հողածածկույթի դասերի անցման մատրիցը ցույց է տալիս, թե որքան տարածք է յուրաքանչյուր դասից անցել մեկ այլ դաս (Աղյուսակ 7): Այս մատրիցում առաջին սյունակում նշված դասերը վերածվում են յուրաքանչյուր տողում ցուցադրված դասերի: Օրինակ՝ ծառածածկույթ շարք, այն տարածքը, որը մնացել է ծառածածկույթով, կազմում է 2909,87 կմ² (ծառածածկույթից անցում դեպի ծառածածկույթ), ծառածածկույթից անցում դեպի արոտավայրեր՝ 362,79 կմ², դեպի մերկ հող՝ 0,02 կմ² և այլն։ Ամենաակտիվ անցումը արոտավայրերից դեպի մշակաբույսերի դաշտեր էր (941 կմ2), մինչդեռ հակադարձ անցումը այդ արժեքի կեսից պակաս է (444 կմ2). Ծառածածկույթից արոտավայրերի անցումը նույնպես նկատելի է (362 կմ2). Մյուս անցումները աննշան են (Նկ. 11).
Այլ դասերին անցումների գումարը համապատասխանում է այս փոխարկումների արդյունքում ծառածածկույթի կորուստին (վերջին սյունակ, 369.92 կմ²): Միևնույն ժամանակ, այլ դասեր անցել են ծառածածկույթ, ինչի արդյունքում այն ավելացել է 230.88 կմ²-ով (ստորին տող): Այսպիսով, ծառածածկույթի զուտ փոփոխությունը կազմում է 139,04 կմ² նվազում։ Այս տվյալները թույլ են տալիս լրացնել հողածածկույթի դասերի ծավալների հաշվարկային աղյուսակում (Աղյուսակ 8) «Ծավալների ավելացումներ» և «Ծավալների նվազեցումներ» տողերը, որոնք անհայտ կլինեին, եթե հայտնի լինեին միայն սկզբնական և վերջնական ծավալները։ Ինչպես նշված է 1.4.A բաժնում, մենք չունենք տվյալներ կառավարվող և չկառավարվող հողածածկույթի փոփոխությունները տարբերակելու համար։
Աղյուսակ 7. Հողածածկույթի դասերի անցման մատրիցը 2017-ից 2023 թվականներին, կմ2
| Ծառի ծածկը | Խոտածածկավայրեր | Մերկ գետնին | Ձյուն/ Սառույց | Ջուր | Հեղեղված բանջարեղեն. | Մշակաբույսեր | Կառուցված | Ընդհանուր մակերեսը 2017 թվականին | Փոքրացում | |
| Ծառածածկույթ → | 2909.87 | 362.79 | 0.02 | 0.05 | 0.58 | 0.02 | 3.74 | 2.72 | 3279.79 | 369.92 |
| Խոտածածկավայրեր → | 224.03 | 19221.76 | 2.12 | 7.56 | 13.46 | 1.74 | 940.92 | 114.62 | 20526.21 | 1304.45 |
| Բաց հող → | 0.05 | 75.63 | 29.67 | 3.70 | 1.97 | 0.24 | 2.10 | 2.59 | 115.94 | 86.27 |
| Ձյուն/Սառույց → | 0.01 | 0.49 | 0.04 | 0.33 | 0.01 | 0.00 | 0.02 | 0.06 | 0.96 | 0.63 |
| Ջուր → | 0.44 | 8.74 | 2.29 | 0.04 | 101.20 | 0.47 | 7.41 | 1.53 | 122.12 | 20.92 |
| Ջրհեղեղված բանջարեղեն → | 0.05 | 3.34 | 0.05 | 0.00 | 4.48 | 4.78 | 1.81 | 0.87 | 15.37 | 10.59 |
| Հացահատիկներ → | 3.04 | 444.42 | 0.42 | 0.29 | 6.62 | 1.18 | 2478.53 | 97.21 | 3031.70 | 553.17 |
| Շերտ առ շերտ→ | 3.27 | 25.79 | 0.76 | 0.03 | 0.50 | 0.02 | 14.40 | 1335.95 | 1380.72 | 44.77 |
| Ընդհանուր մակերեսը 2023 թվականին | 3140.75 | 20142.95 | 35.35 | 12.00 | 128.82 | 8.46 | 3448.92 | 1555.56 | 28472.82 | |
| Ընդլայնում | 230.88 | 921.19 | 5.69 | 11.67 | 27.62 | 3.68 | 970.39 | 219.61 | 2390.73 |
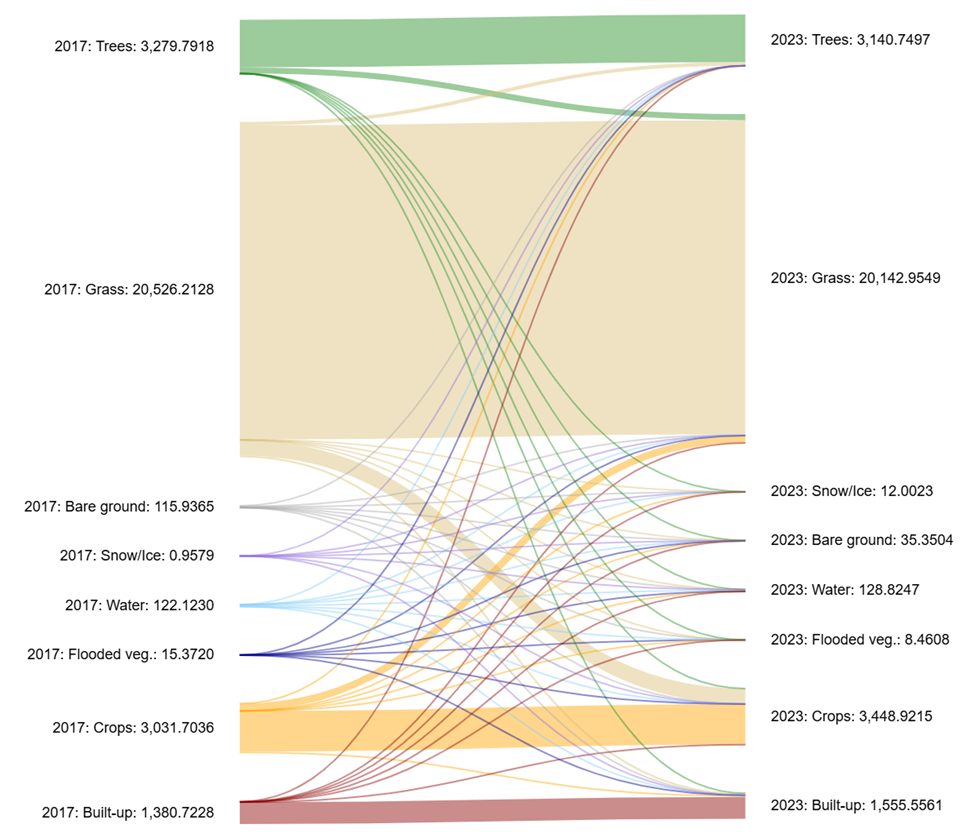
Նկար 11. Հողի ծածկույթի դասերի միջև անցումները 2017–2023 թվականներին
Աղյուսակ 8. Հողածածկույթի դասերի տարածքի հաշվարկային աղյուսակը 2017 և 2023 թվականների համար՝ հիմնված ESRI-ի հողածածկույթի տվյալների հավաքածուի վրա։ 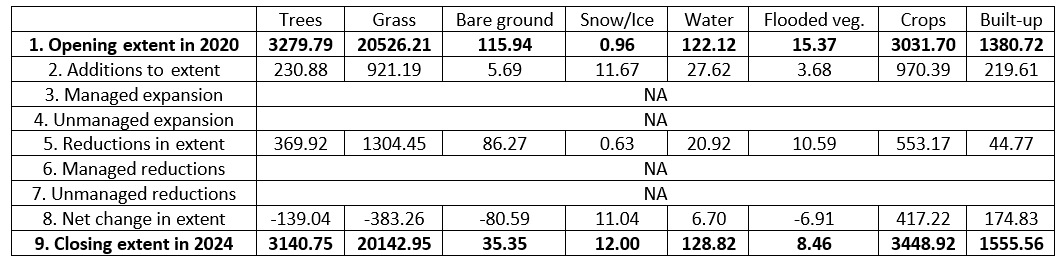
Ամենանշանակալից փոփոխությունները տեղի ունեցան Շիրակ մարզում, որտեղ մշակվող հողատարածքների մակերեսը ավելացավ 200 քառ. կմ-ով՝ խոտածածկ տարածքների հաշվին։ Նման, սակայն ավելի փոքրածավալ մշակվող հողատարածքների ընդլայնում խոտածածկ տարածքների հաշվին տեղի ունեցավ Լոռի, Գեղարքունիք և Արագածոտն մարզերում։ Հակառակ դրան՝ Արմավիրում և Արարատում մշակվող հողատարածքների մակերեսը նվազեց։ Արմավիրում դա պայմանավորված էր կառուցապատված տարածքների աճով, իսկ Արարատում՝ և՛ կառուցապատված տարածքների, և՛ արոտավայրերի ընդլայնմամբ։ Սյունիքի մարզում անտառային տարածքը նկատելիորեն նվազել է արոտավայրերի և հացահատիկային ցանքատարածքների աճի պատճառով։ Հողածածկույթի տարածքների հարաբերական փոփոխությունները ներկայացնում են որոշակիորեն այլ պատկեր։ 2023 թվականին ESRI-ի հողի ծածկույթի տվյալների հավաքածուն ցույց է տալիս Արմավիրի մարզում ծառածածկույթի 80% կորուստ 2017 թվականի համեմատ, թեև այս կորուստը բացարձակ թվերով գրեթե չի նկատվում՝ տվյալ մարզում սկզբնական փոքր անտառային տարածքի պատճառով։ Հողագործական տարածքների ամենամեծ հարաբերական աճը գրանցվել է Լոռիի մարզում՝ մոտ 60%։
Աղյուսակ 9. Երկրի ծածկույթի դասերի մակերեսի փոփոխություններ 2017–2023 թվականներին, կմ²
| Rangeland | Ծառեր | Մերկ հող | Ձյուն/Սառույց | Հեղեղված բուսականություն | Ջուր | Մշակաբույսեր | Կառուցված տարածք | |
| ԱՐԱԳԱԾՈՏՆ | -64.22 | -4.29 | -9.12 | 6.36 | 0.00 | 0.06 | 58.36 | 12.84 |
| ԱՐԱՐԱՏ | 37.35 | -4.28 | -9.42 | 0.04 | -4.96 | 3.27 | -54.46 | 32.46 |
| ԱՐՄԱՎԻՐ | 6.30 | -2.29 | -3.41 | 0.00 | -1.65 | 0.43 | -35.88 | 36.50 |
| ԳԵՂԱՐՔՈՒՆԻՔ | -80.52 | -5.37 | -14.81 | 0.90 | -0.75 | -0.02 | 89.89 | 10.68 |
| ԿՈՏԱՅՔ | 2.07 | -18.64 | -6.39 | 0.86 | -0.01 | 0.08 | -5.26 | 27.28 |
| ԼՈՌԻ | -133.47 | 14.22 | -1.72 | 0.28 | 0.35 | 1.17 | 109.66 | 9.50 |
| ՇԻՐԱԿ | -214.12 | 0.34 | -3.40 | 2.47 | -0.06 | 4.26 | 205.33 | 5.18 |
| ՍՅՈՒՆԻՔ | 79.18 | -126.52 | -20.49 | -0.04 | -0.02 | -2.12 | 62.58 | 7.44 |
| ՏԱՎՈՒՇ | -6.54 | 12.23 | -1.28 | 0.04 | 0.02 | 0.35 | -9.49 | 4.68 |
| ՎԱՅՈՑ ՁՈՐ | 16.90 | -8.97 | -11.50 | 0.33 | -0.01 | -0.41 | -1.98 | 5.63 |
| ՀԱՅԱՍՏԱՆ | -364.25 | -143.52 | -82.35 | 11.23 | -7.08 | 7.04 | 403.85 | 175.08 |
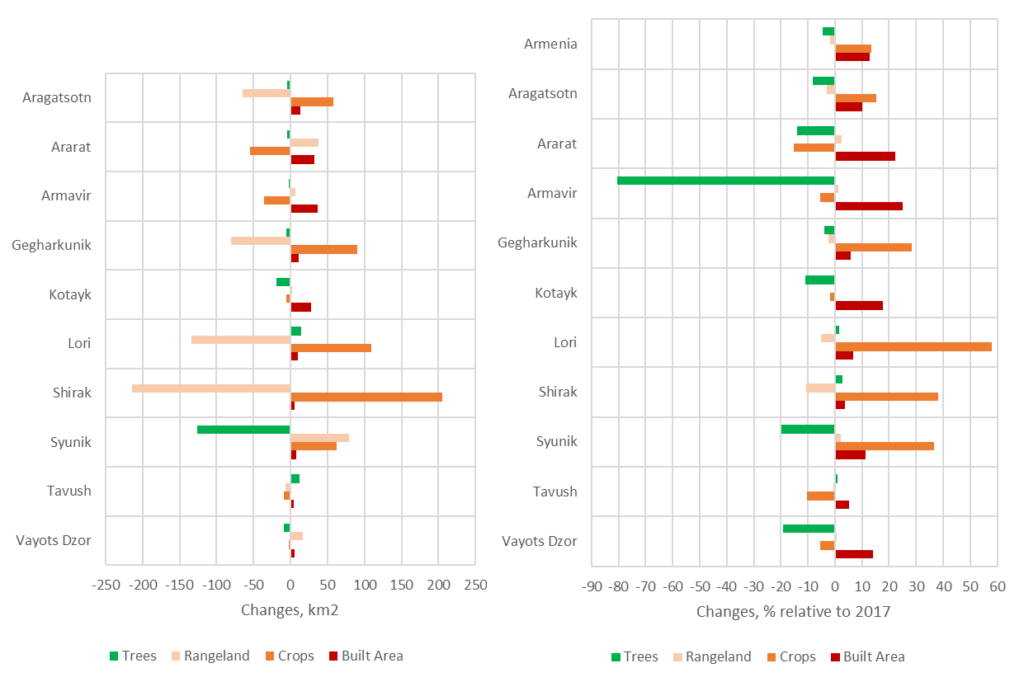
Նկ. 12. Անհատական (կմ²) և հարաբերական (2017 թ. տարածքի %) փոփոխություններ Ադրբեջանում և մարզերում հիմնական հողածածկույթի դասերի տարածքներում 2017–2023 թթ.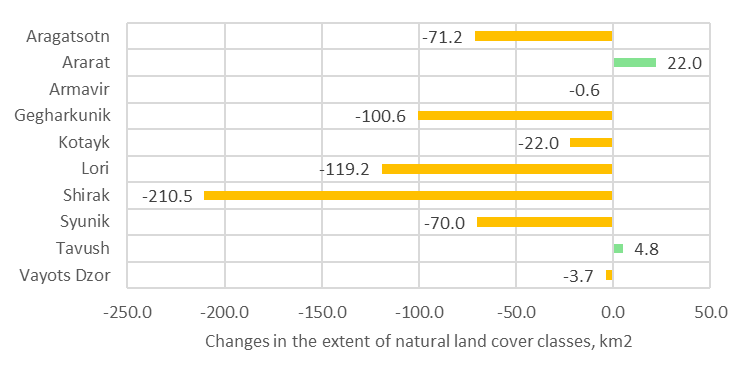
Նկար 13. Բնական հողածածկույթի դասերի ընդհանուր փոփոխությունները մարզերում 2017–2023 թվականներին
Հողածածկույթի տարածքի ամենանշանակալի փոփոխությունները տեղի են ունեցել Ախուրյան ջրհավաք ավազանում (Շիրակ մարզ), որտեղ մշակվող հողերի տարածքը ավելացել է 200 կմ²-ով՝ խոտածածկ տարածքների հաշվին։ Նման, սակայն ավելի փոքր մասշտաբի մշակվող հողերի ընդլայնում խոտածածկ տարածքների հաշվին տեղի է ունեցել Դեբեդ ջրհավաք ավազանում (Լոռի մարզ)։ Ռազդան և Մեծամորի ջրբաժաններում արոտավայրերի մակերեսը նվազել է հողագործական և կառուցապատված տարածքների ընդլայնման պատճառով։ Արփայի ջրբաժանում տեղի ունեցած փոփոխությունները պայմանավորված են Արարատի մարզում տեղի ունեցած փոփոխություններով, որտեղ հողագործական տարածքը նվազել է կառուցապատված տարածքների և արոտավայրերի ընդլայնման պատճառով։ Վորոտանի ջրբաժանում (Սյունիքի մարզ) անտառային տարածքը զգալիորեն նվազել է արոտավայրերի և հողագործական տարածքների ավելացման պատճառով։
Հարաբերական փոփոխությունները ցույց են տալիս, որ Դեբեդի ջրահավաք ավազանում (Լոռի մարզ) հողատարածքների մշակման մակերեսը ամենամեծ հարաբերական աճն է գրանցել, իսկ Վորոտանի (Սյունիքի մարզ) և Ախուրյանի (Շիրակի մարզ) ջրահավաք ավազաններում նշանակալիորեն ավելացել է հողատարածքների մշակման մակերեսը։ Վորոտանի, Արփայի և Մեծամորի ջրահավաք ավազաններում անտառային տարածքը նվազել է 10–20 %-ով։
Աղյուսակ 10. 2017–2023 թթ. ջրահավաք ավազաններում հողածածկույթի դասերի մակերեսի փոփոխություններ, կմ²
| Rangeland | Ծառեր | Մերկ հող | Ձյուն/Սառույց | Հեղեղված բուսականություն | Ջուր | Մշակաբույսեր | Կառուցված տարածք | |
| Աղստեւ | -9.77 | -4.20 | -1.90 | 0.08 | 0.02 | 0.34 | 10.39 | 5.04 |
| Ախուրյանը | -197.84 | 0.25 | -3.52 | 2.36 | -0.06 | 4.29 | 189.17 | 5.35 |
| Արփա | 51.72 | -13.62 | -21.36 | 0.58 | -4.62 | 3.19 | -38.73 | 22.85 |
| Դեբեդ | -144.43 | 21.82 | -1.99 | 0.25 | 0.35 | 1.18 | 112.69 | 10.12 |
| Հրազդան | -78.67 | -14.69 | -21.18 | 1.52 | -1.01 | -0.32 | 29.54 | 84.81 |
| Մեծամոր | -64.09 | -6.59 | -12.06 | 6.46 | -1.75 | 0.47 | 38.10 | 39.46 |
| Որոտան | 78.89 | -126.52 | -20.28 | -0.02 | -0.02 | -2.12 | 62.62 | 7.45 |
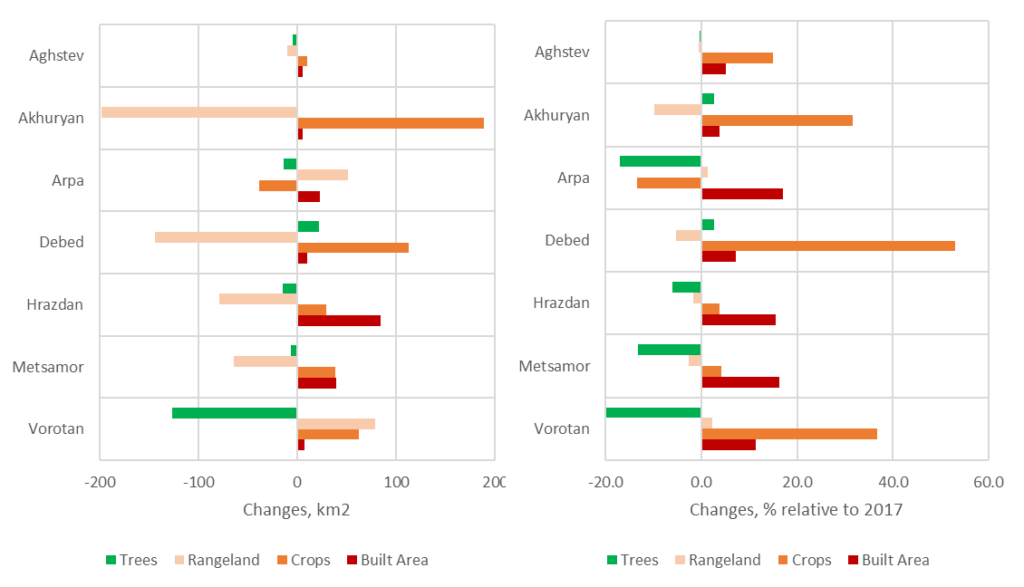
Նկար 13. 2017 թ. տարածքի նկատմամբ հիմնական հողածածկույթի դասերի տարածքի բացարձակ (կմ2) և հարաբերական (2017 թ. տարածքի %) փոփոխությունները ջրահավաք ավազաններում 2017–2023 թթ.