Ներողություն ենք խնդրում կայքի մեքենայական թարգմանության հնարավոր սխալների համար
3.1.A.5. Ցամաքային էկոհամակարգերի սառեցման ազդեցությունը
(InVEST Urban Cooling)
ԳԻՍ մոդելավորում և վերլուծություն, արդյունքների ներկայացում – Էդուարդ Կազակով (NextGIS OÜ, Էստոնիա);
Արդյունքների վերլուծություն և ներկայացում – Ելենա Բուկվարևա (ԲԿԿ-Հայաստան)
InVEST մոդելի արդյունքները միջնորդ փոփոխականներ են, որոնք պետք է մեկնաբանվեն հարաբերական առումով, այլ ոչ թե ֆիզիկական մեծությունների: Այնուամենայնիվ, բացահայտված արժեքներն օգտակար են երկրի տարածքում ծառայությունների տարածական բաշխվածության և դրանց հավասարակշռությունը բնակչության և տնտեսության կողմից ծառայությունների օգտագործման ցուցանիշների հետ վերլուծելու համար:.
Այս բաժինը ներկայացնում է էկոհամակարգային ծառայությունների գնահատման և քարտեզագրման մոդելների փորձարկման նախնական արդյունքները: Հետագայում, եթե որոշում կայացվի օգտագործել այդ մոդելները, ապա դրանք պետք է չափորոշվեն Հայաստանում կատարված օդերևութաբանական չափումների միջոցով։
Քանի որ մոդելը հիմնականում կենտրոնացած է բնակավայրերի ներսում սառեցման էֆեկտի վրա, դրա առանձնահատկություններից մեկն այն է, որ այն քարտեզագրում է ծառայությունը մի ուղղանկյունի մեջ, որն ընդգրկում է բոլոր բնակավայրերը: Արդյունքում, սահմաններին մոտ գտնվող փոքր տարածքները դուրս են մնացել մոդելավորումից: Մեր դեպքում սա ներկայացնում է աննշան սխալ, որը կարելի է անտեսել: Այնուամենայնիվ, այս թերությունը պետք է հաշվի առնել հետագա վերլուծությունների ժամանակ:
Մենք այս մոդելում օգտագործել ենք նույն գոլորշիացման գործակիցները, կլիմայական գոտիները և սցենարները, ինչ SWY.
InVEST մոդելը Urban Cooling Effect այն հիմնականում ուղղված է քաղաքային տարածքներում կանաչ տարածքների սառեցման ազդեցության գնահատմանը: Այնուամենայնիվ, այն նաև թույլ է տալիս գնահատել այս ազդեցությունը քաղաքներից դուրս գտնվող մեծ տարածքներում: Քանի որ քաղաքային էկոհամակարգային ծառայությունների գնահատումը մեր ծրագրի նպատակը չէ, մենք կենտրոնացել ենք առաջին հերթին Հայաստանի ողջ տարածքի և բնակավայրերի վրա դրա ազդեցության վրա: Բնակավայրերի ներսում կանաչ տարածքները գնահատման առանցքում չեն եղել:
InVEST Urban Cooling մոդելը հաշվարկում է ջերմության մեղմացման ինդեքսը՝ հիմնվելով կանաչ տարածքների հովացման հզորության և դրանցից հեռավորության վրա: Մոդելը հաշվարկում է հովացման հզորության (CC) ինդեքսը յուրաքանչյուր պիքսելի համար՝ հիմնվելով տեղական ստվերի, գոլորշիացման և ալբեդոյի վրա: СС-ն օգտագործվում է էկոհամակարգերի կողմից ջերմաստիճանի նվազումը գնահատելու համար։
Ջերմության մեղմման ինդեքսը (Heat Mitigation index, HM) գնահատում է մեծ կանաչ տարածքների (>2 հա) զովացուցիչ ազդեցությունը շրջակա քաղաքային տարածքների վրա։ Մեր դեպքում այն ցույց է տալիս շրջակա տարածքի ազդեցությունը բնակավայրերի վրա։ HM-ը հավասար է CC-ին, եթե պիքսելը չի գտնվում որևէ մեծ կանաչ տարածքի ազդեցության տակ, իսկ հակառակ դեպքում այն հաշվարկվում է որպես մեծ կանաչ տարածքների և հետաքրքրության պիքսելի CC արժեքների հեռավորությանը համապատասխան կշռված միջին։
Մոդելի հաշվարկները հիմնված են էվապոտրանսպիրացիայի, ալբեդոյի, LULC դասերում ծառերի թաղանթով (ստվեր) ծածկված տարածքի մասնաբաժնի, գյուղական հղման տարածքի օդի ջերմաստիճանի և UHI (Քաղաքային Ջերմային Ինդեքս) ցուցանիշների վրա։ Վերջին գործակիցը ցույց է տալիս գյուղական հղման ջերմաստիճանի և քաղաքում արձանագրված առավելագույն ջերմաստիճանի միջև տարբերությունը։ UHI-ն մոդելում ներառված է որպես մեկ միասնական արժեք։ Հաշվարկները մեկ UHI արժեքի հիման վրա ամբողջ Արմենիայի համար անհնարին են պայմանների զգալի տատանումների պատճառով տարբեր քաղաքներում։ Թերմալ պատկերներ (Landsat 8 մակերևութային ջերմաստիճանի տվյալներ՝ ԱՄՆ Երկրաբանական ծառայության շնորհիվ; Scene ID: LC08_L2SP_170032_20240823_02_T1) պատկերները ցույց են տալիս, որ ամենաշոգ շրջանում (օգոստոս) Երևանը շրջակա տարածքներից ավելի զով է, Գյումրին ունի մոտավորապես նույն ջերմաստիճանը, իսկ Դիլիջանը ավելի տաք է (Նկ. 31A5-1–31A5-3): «Global Surface UHI Explorer»-ի տվյալները հաստատում են, որ Արմենիայում չկա միատարր UHI գործակից։ Գործակիցը տատանվում է ոչ միայն քաղաքից քաղաք (Երևանը ավելի զով է, Գյումրին՝ ավելի տաք, քան շրջակա տարածքը), այլև նույն քաղաքի տարբեր մասերում (Նկ. 31A5-4)։ Ուստի մենք UHI=0 ենք կիրառել, այսինքն՝ հաշվի չենք առել այս գործոնի ազդեցությունը։
Նկար 31A5-1. Երևանի ջերմային պատկեր

Նկար 31Ա5-2. Գյումրու ջերմային պատկերը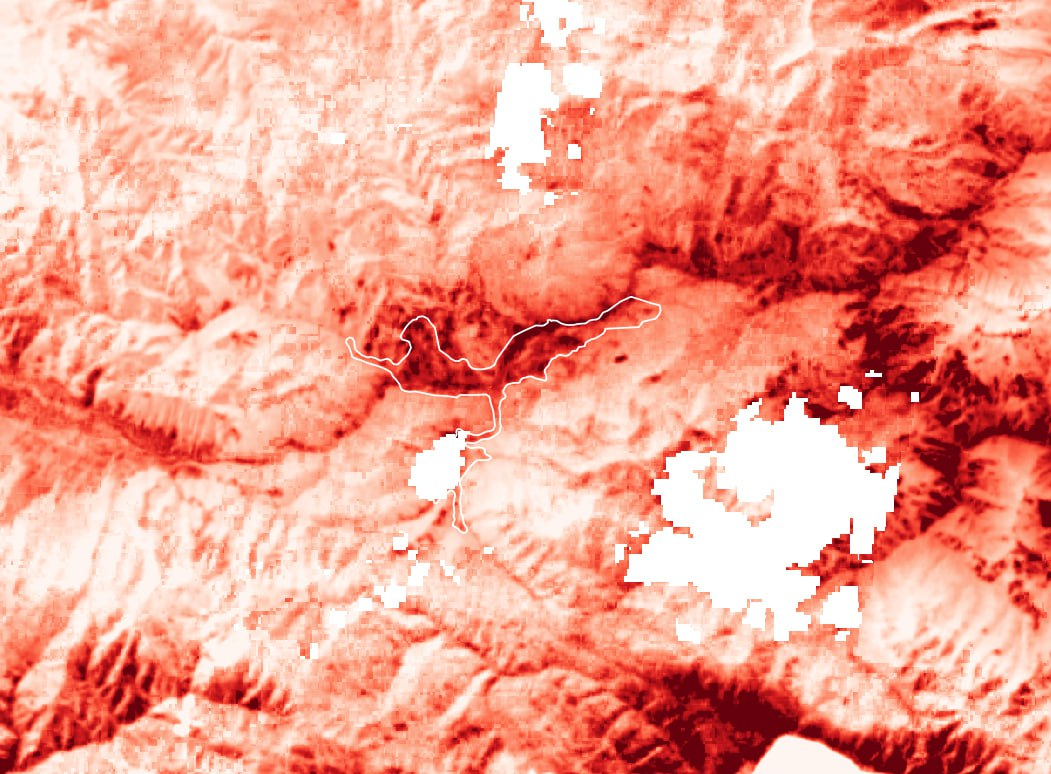
Նկար 31Ա5-3. Դիլիջանի ջերմային պատկերը
Տվյալներ Global Surface UHI Explorer հաստատել, որ Հայաստանի համար մեկ UHI գործակից չկա։ Գործակիցը տատանվում է ոչ միայն քաղաքից քաղաք (Երևանն ավելի զով է, Գյումրին ավելի տաք է, քան շրջակա տարածքը), այլ նաև նույն քաղաքի տարբեր հատվածներում։
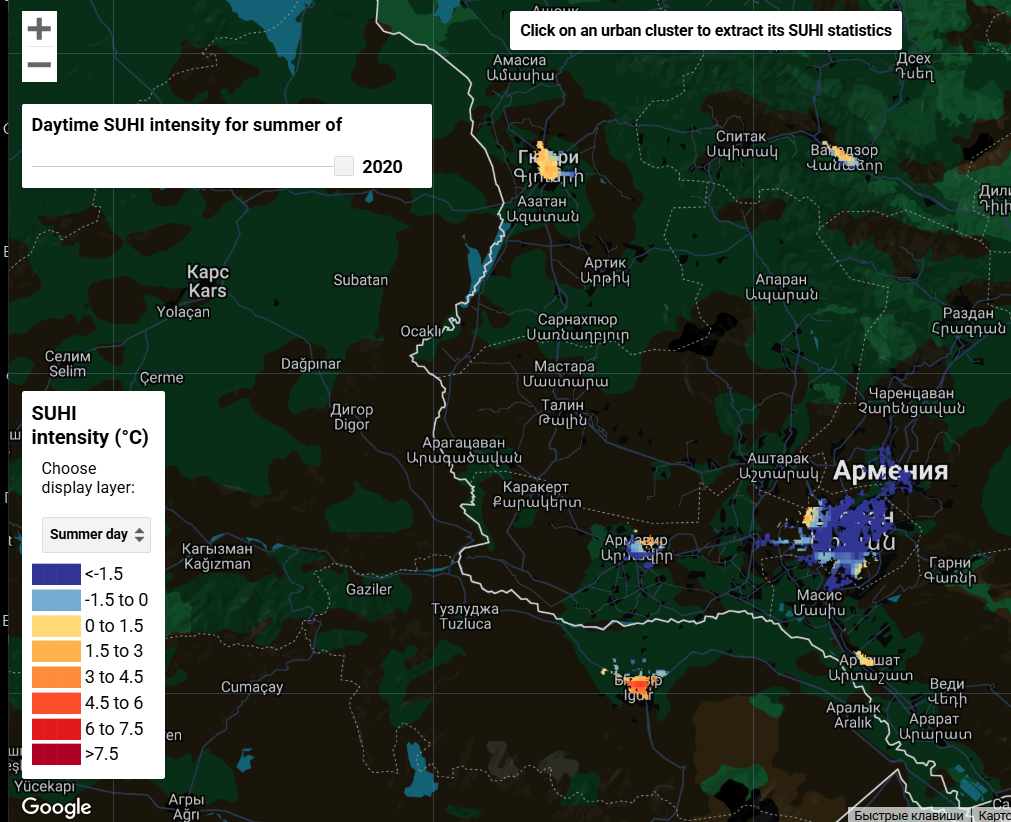
Նկար 31Ա5-4. Ամառվա UHI արժեքներ (Հայաստանի արևմտյան մաս)
Երկրային էկոհամակարգերի կողմից ապահովվող էկոլոգիական ծառայություններ
Հողածածկույթի դասերի սառեցման հզորության (CC) գնահատականները հիմնված են ալբեդոյի, եվապոտրանսպիրացիոն սառեցման և ստվերի (այսինքն՝ ծառերի թաղանթով ծածկված տարածքի մասնաբաժին) գործակիցների հավասարակշռության վրա։ InVEST-ի առաջարկություններին համապատասխան կիրառված Kс և ալբեդո գործակիցները ցամաքային ծածկույթի դասերի համար տվել են հետևյալ CC արժեքները (Աղյուսակ 31A5-1; Նկ. 31A5-5):
– Առավելագույն CC-ն կապված է անտառների հետ՝ բարձր եվտրանսպիրացիոն զովացման պատճառով։
– Չոր և խոնավ կլիմայական գոտիներում մշակաբույսերի հողամասերի CC-ի բարձր արժեքները բացատրվում են այդ տարածաշրջաններում այգիների մեծ մասնաբաժնով (ըստ ArmStat տվյալների): միջին չոր և զով կլիմայական գոտիներում, որտեղ այգիները հազվադեպ են, մշակաբույսերի հողամասերի CC-ն շատ ավելի ցածր է և մոտենում է մերկ հողի և արոտավայրերի արժեքներին:
– Շինապատված տարածքների համեմատաբար բարձր CC արժեքները պայմանավորված են մեր այն ենթադրությամբ, որ բնակավայրերի տարածքի միջինում 20%-ը ծածկված է ծառերով (ստվեր=0.2): Բնակավայրերում ծառածածկույթի տարածքը մեծացնելը կմեծացնի շինապատված տարածքների CC-ն, իսկ նվազեցնելը՝ կնվազեցնի այն։
– Խոտածածկ տարածքների CC-ն երեք կլիմայական գոտիներում ցածր է մերկ հողի ցուցանիշից, իսկ խոնավ գոտում միայն թեթևակի բարձր է։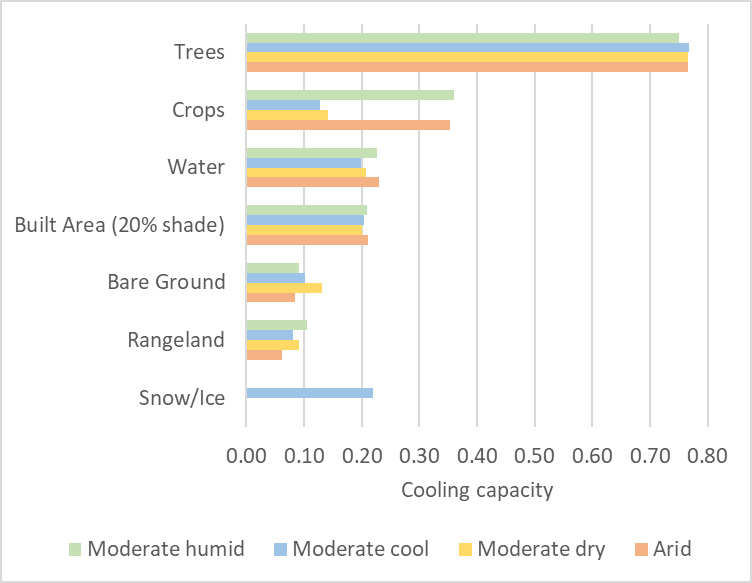
Նկ. 31A5-5. Հողածածկույթի դասերի զովացուցիչ կարողությունը տարբեր կլիմայական գոտիներում
Աղյուսակ 31A5-1. Երկրի ծածկույթի դասերի հովացման հզորությունը տարբեր կլիմայական գոտիներում
| Չոր | Չափավոր չորություն | Չափավոր սառը | Չափավոր խոնավ | |
| Ձյուն/Սառույց | 0.22 | |||
| Rangeland | 0.06 | 0.09 | 0.08 | 0.11 |
| Մերկ հող | 0.08 | 0.13 | 0.10 | 0.09 |
| Կառուցված տարածք (20% երանգ) | 0.21 | 0.20 | 0.20 | 0.21 |
| Ջուր | 0.23 | 0.21 | 0.20 | 0.23 |
| Մշակաբույսեր | 0.35 | 0.14 | 0.13 | 0.36 |
| Ծառեր | 0.77 | 0.77 | 0.77 | 0.75 |
Այս CC-արժեքների շարքում՝ ըստ հողածածկույթի դասերի, ամենաուշագրավն այն է, որ խոտածածկ տարածքների CC-ն ավելի ցածր է, քան մերկ հողի, այսինքն՝ խոտածածկ տարածքները ավելի տաք են, քան մերկ հողը։ Այնուամենայնիվ, չորային գոտիներում նման CC-կապ հնարավոր է, քանի որ չոր սեզոնին խոտածածկ տարածքներից եվապոտրանսպիրացիան նվազագույն է կամ բացակայում է, իսկ չոր մերկ հողի ալբեդոն կարող է գերազանցել չորացած խոտի ալբեդոյին։ Բացի այդ, մակերեսային անհարթության պատճառով չոր խոտածածկույթը ավելի դանդաղ է սառչում, քան մերկ հողը։ Կան օրինակներ, երբ չոր բուսածածկույթը տրոպիկական գոտուց (Ֆելդման և այլք, 2022) և Կենտրոնական Եվրոպայից (Հեսլերովա և այլք, 2013) ավելի տաք է, քան մերկ հողը։ Այնուամենայնիվ, Արմենիայի համար այս CC հարաբերությունը պահանջում է մանրակրկիտ ստուգում։ CC-ն որոշող ցանկացած գործակցի (էվապոտրանսպիրացիա, ալբեդո և ծառածածկույթ (ստվեր)) փոփոխությունը կարող է փոխել CC-ի հարաբերակցությունը տարբեր հողածածկույթի դասերի միջև։ Սա ընդգծում է մոդելի կալիբրացման անհրաժեշտությունը։ Բնական ցամաքային էկոհամակարգերի կողմից մատուցվող էկոհամակարգային ծառայությունները (ES) գնահատվել են որպես ցուցիչի արժեքների տարբերությունը 2023 թվականի հողածածկույթի և մերկ հողի սցենարի միջև։ Բաց հողի սցենարիայում CC-ն զգալիորեն նվազում է ներկայումս անտառապատ տարածքներում և մի փոքր աճում է ներկայումս խոտածածկ տարածքներում՝ միջին ցուրտ, չոր և չորային գոտիներում։ Բնական բուսածածկույթը ապահովում է զգալի զովացում անտառապատ տարածքներում, թույլ զովացում խոնավ միջին գոտու խոտածածկ տարածքներում և թույլ տաքացում մյուս գոտիների խոտածածկ տարածքներում (Նկ. 31A5-6)։ 
Նկ. 31A5-6. Սառեցման հզորության քարտեզներ. Մանրամասների համար տես քարտեզները «Էկոհամակարգային ծառայություններ/Քաղաքային հովացում» բաժնում
Բնական բուսածածկույթը սառեցնում է Տավուշի, Լոռիի, Սյունիքի և Կոտայքի մարզերը և մի փոքր տաքացնում է անտառազուրկ մարզերը։ Տավուշի և Լոռիի մարզերում, որտեղ անտառային տարածքը զգալի է, անտառը համապատասխանաբար 77% և 57%-ով բարձրացնում է CC-ն (Նկ. 31A5-7)։ Հայաստանում ներկայիս հողածածկույթի CC-ն միջինում 0.19 է, իսկ մերկ հողի սցենարի դեպքում՝ 0.15; հետևաբար էկոհամակարգերը միջինում հովացնում են հողի մակերեսը՝ բարձրացնելով CC-ն 0.04-ով (21%): Նկ. 31A5-7. Ներկա հողածածկույթի սառեցման հզորություն և բնական բուսածածկույթի ազդեցությունը սառեցման հզորության վրա
Քանի որ մենք բնակավայրերի ներսում ES-ը չենք գնահատել, մեր գնահատականը վերաբերում է շրջակա էկոհամակարգերի բնակավայրերի ներսում CC-ի վրա ունեցած ազդեցությանը՝ ենթադրելով բոլոր բնակավայրերի համար միատարր 20 % ծառածածկույթ (ստվեր): Ջերմության մեղմման ցուցանիշը (Heat Mitigation index, HM) գնահատում է մեծ կանաչ տարածքների (>2 հա) զովացուցիչ ազդեցությունը շրջակա քաղաքային տարածքների վրա։ Մեր դեպքում այն ցույց է տալիս շրջակա տարածքի ազդեցությունը բնակավայրերի վրա։ HM-ը հավասար է CC-ին, եթե պիքսելը չի գտնվում որևէ մեծ կանաչ տարածքի ազդեցության տակ, իսկ հակառակ դեպքում այն հաշվարկվում է որպես մեծ կանաչ տարածքների և հետաքրքրության պիքսելի CC արժեքների հեռավորությանը համապատասխան կշռված միջին (Նկ. 31A5-8)։ 
Նկար 31A5-8. Ջերմային մեղմման ցուցանիշ. Մանրամասների համար տես քարտեզները «Էկոհամակարգային ծառայություններ/Քաղաքային հովացում» բաժնում
Շրջակա էկոհամակարգերի սառեցման/տաքացման ազդեցությունը կախված կլինի էկոհամակարգերի CC-ից, ինչպես նաև բնակավայրի սահմանների երկրաչափությունից, այսինքն՝ բնակավայրի այն տարածքի հարաբերակցությունից, որը գտնվում է շրջակա տարածքի ազդեցության տակ։ Հետևելով InVEST-ի առաջարկին՝ մենք առավելագույն սառեցման հեռավորությունը՝ այն հեռավորությունը, որի վրա 2 հա-ից մեծ կանաչ տարածքները ունեն սառեցման ազդեցություն, սահմանել ենք 450 մ։ 1 016 գնահատված բնակավայրերում միջին CC-ն տատանվում է 0.06-ից մինչև 0.50 (այսինքն՝ հնարավոր առավելագույն արժեքի կեսը)։ (Հայաստանի 1016 բնակավայրերի ՍԴ արժեքների աղյուսակ) Բնակավայրերի ներսում էկոհամակարգերի ազդեցությունը CC-ի վրա հաշվարկվել է որպես ներկայիս հողածածկույթի պայմաններում և մերկ հողի սցենարի պայմաններում CC-ի արժեքների տարբերություն։ Գնահատված բնակավայրերի մեծ մասում (729, կամ 72%) շրջակա էկոհամակարգերը մերկ հողի համեմատ CC-ի վրա գրեթե որևէ փոփոխություն չեն առաջացնում։ 133 բնակավայրերում (13%) էկոհամակարգերը նվազեցնում են CC-ն, այսինքն՝ ջերմացնող ազդեցություն են ունենում; դրանք ակնհայտորեն շրջապատված են խոտածածկով երեք կլիմայական գոտիներից մեկում՝ չափավոր չոր, ցուրտ կամ չորային։ 154 բնակավայրերում (15%) էկոհամակարգերը մեծացնում են CC-ն, այսինքն՝ ունեն սառեցնող ազդեցություն; այս բնակավայրերը շրջապատված են անտառներով կամ խոտածածկով միջին խոնավության գոտում։ 20 անտառով շրջապատված բնակավայրերում, այդ թվում՝ Դիլիջանում, Ջերմուկում, Ցախկաձորում, զովացնող ազդեցությունը հատկապես նկատելի է՝ CC-ն աճում է 0.10–0.35-ով (Նկ. 31A5-9; Հայաստանի 1,016 բնակավայրերի համար էկոհամակարգային ազդեցության CC արժեքների աղյուսակը).  Նկ. 31A5-9. Բնակավայրերում CC-ի վրա շրջակա էկոհամակարգերի ազդեցությունը
2. ES-ը փոխվում է 2017-ից մինչև 2023 թ
2017 թվականից մինչև 2023 թվականը CC-ում տեղի են ունեցել փոքր փոփոխություններ, որոնք տարբեր ուղղություններով են եղել տարբեր վայրերում և մարզերում (Նկ. 31A5-10): CC-ի զգալի նվազում գրանցվել է Սյունիքում՝ որոշ անտառների փոխարինման արդյունքում խոտածածկ տարածքներով, ինչպես նաև Արարատում՝ որոշ հողատարածքների փոխարինման արդյունքում խոտածածկ տարածքներով և կառուցապատված տարածքներով։ CC-ի աճ է գրանցվել Շիրակում և Լոռիում՝ որոշ խոտածածկ տարածքների փոխարինման արդյունքում հողատարածքներով (Նկ. 31A5-11; (հողածածկույթի փոփոխությունների համար տես այստեղ).
Բնակավայրերում CC-ի փոփոխությունները տատանվում են 61%-ի նվազումից մինչև 65% աճ: (Բնակավայրերում ՍԴ արժեքի փոփոխությունների աղյուսակ).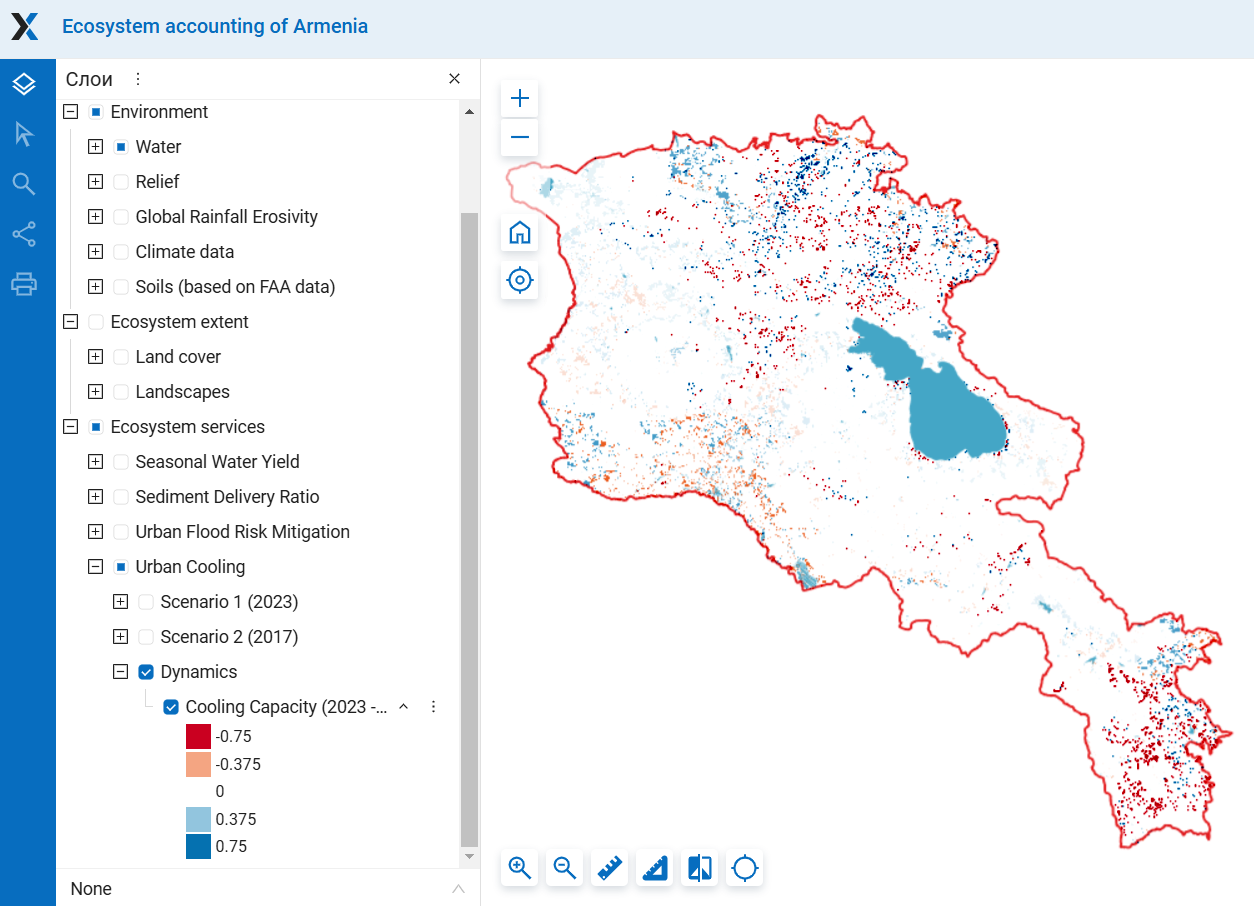
Նկար 31A5-10. CC-ի փոփոխությունները 2017-ից մինչև 2023 թվականը. Մանրամասն քարտեզների համար դիտեք նախագծի Web GIS-ը, «Էկոհամակարգային ծառայություններ/Քաղաքային հովացում/Դինամիկա» բաժինը։
 Նկ. 31A5-11. CC-ի փոփոխությունները մարզերում 2017–2023 թվականներին