Ներողություն ենք խնդրում կայքի մեքենայական թարգմանության հնարավոր սխալների համար
Ջրի հոսքի սեզոնային կարգավորման ES
(InVEST սեզոնային ջրի բերքատվության մոդել)
GIS մոդելավորում և վերլուծություն, արդյունքների ներկայացում – Էդուարդ Կազակով (NextGIS OÜ, Էստոնիա);
Արդյունքների վերլուծություն և ներկայացում – Ելենա Բուկվարևա (BCC-Հայաստան);
Հայաստանի իրական ջրբաժանների հետ արդյունքների համապատասխանության գնահատում – Վարդան Ասատրյան (ՀՀ ԳԱԱ)
Մոդելավորման արդյունքների համապատասխանության գնահատում Հայաստանի համար. արտաքին փորձագետ Ալեքսանդր Առաքելյան (ՀՀ ԳԱԱ)
Երկրային մակերևութային հոսքի սեզոնային վերաբաշխման և հիմքային հոսքի ապահովման էկոլոգիական նշանակությունը չափազանց կարևոր է Արմենիայի համար, որը ունի սեզոնային կլիմա՝ տարածքի մեծ մասում չոր ամառներով։ Այս էկոլոգիական նշանակությունը գնահատվել և քարտեզագրվել է՝ օգտագործելով InVEST-ի սեզոնային ջրառատության մոդել. Մոդելը հաշվի է առնում յուրաքանչյուր պիքսելի ամսական տեղումների քանակը, հողի թափանցելիությունը և ջրային բալանսը, ներառյալ վերևի պիքսելներից ստացվող խոնավությունը։ Էկոհամակարգային ծառայությունը գնահատելու հիմնական ցուցանիշներն են արագ հոսքը (QF), այսինքն՝ այն հոսքի գեներացումը, որի ջրահավաք ավազանի մնալու ժամանակը տևում է ժամերից մինչև օրեր, և հիմքային հոսքը (B), այսինքն՝ այն հոսքի գեներացումը, որի ջրահավաք ավազանի մնալու ժամանակը տևում է ամիսներից մինչև տարիներ։ Կուտակված հիմքային հոսքի (Bsum) արժեքները ցույց են տալիս յուրաքանչյուր պիքսելի միջով հոսքը, որը գոյանում է վերին բոլոր պիքսելներից (Նկ. 31A2-1): Հիմքային հոսքը ապահովում է հոսքի պահպանությունը չոր սեզոնին և հնարավոր երաշտների ժամանակ։
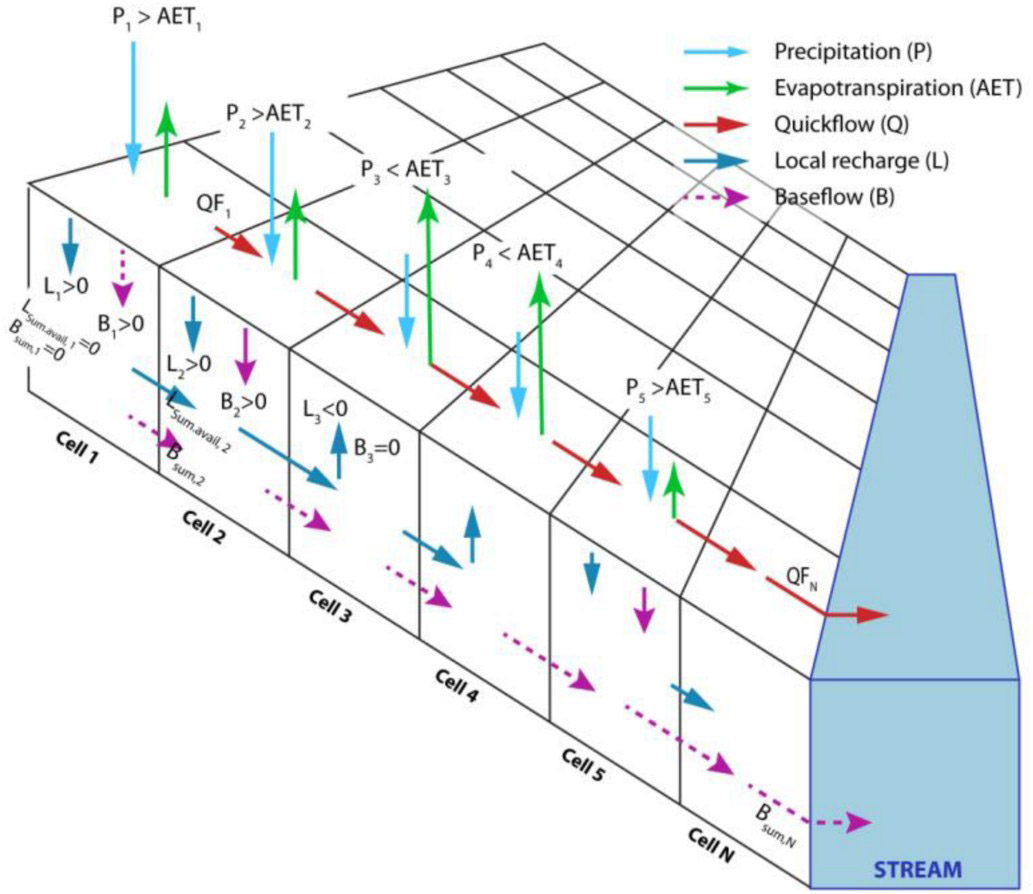
Նկար 31A2-1. InVEST մոդելի սեզոնային ջրառատության դիագրամը (Համել և այլք, 2020)
Մոդելավորման համար օգտագործված գործակիցները կարող եք գտնել այստեղ
InVEST մոդելի արդյունքները միջնորդ փոփոխականներ են, որոնք պետք է մեկնաբանվեն հարաբերական առումով, այլ ոչ թե ֆիզիկական մեծությունների: Այնուամենայնիվ, բացահայտված արժեքներն օգտակար են երկրի տարածքում ծառայությունների տարածական բաշխվածության և դրանց հավասարակշռությունը բնակչության և տնտեսության կողմից ծառայությունների օգտագործման ցուցանիշների հետ վերլուծելու համար:.
Այս բաժինը ներկայացնում է էկոհամակարգային ծառայությունների գնահատման և քարտեզագրման մոդելների փորձարկման նախնական արդյունքները: Հետագայում, եթե որոշում կայացվի օգտագործել այս մոդելները, ապա դրանք պետք է չափորոշվեն Հայաստանում կատարված հիդրոլոգիական չափումների միջոցով։
Մեթոդաբանությունը և արդյունքները մանրամասն կներկայացվեն առաջիկա հրապարակման մեջ.
Երկրային էկոհամակարգերի կողմից ապահովվող էկոլոգիական ծառայություններ
Իրական հողածածկույթի (ESRI 2023) համար հիմնական հոսքի (B) արժեքները շատ ավելի բարձր են, մինչդեռ արագ հոսքի (QF) արժեքները, հակառակ դեպքում, ավելի ցածր են՝ համեմատած հիպոթետիկ դեպքերի հետ, երբ բոլոր բնական էկոհամակարգերը փոխարինվում են մերկ հողով կամ մշակաբույսերի հողատարածքներով (աղյուսակ 31A2-1): Փաստացի հողածածկույթի և մերկ հողի համար հոսքի արժեքների միջև տարբերությունը կարելի է մեկնաբանել որպես հողային բուսականության կողմից ապահովված ES՝ միջինում B = 47.8 մմ և QF = -22.2 մմ։ Այսպիսով, էկոհամակարգերը ապահովում են հիմքային հոսքի 93% և նվազեցնում արագ հոսքը 22%-ով։
ES քարտեզները ցույց են տալիս, որ մերկ հողի և մշակաբույսերի ցանքատարածքների սցենարների դեպքում հիմքային հոսքը գրեթե բացակայում է (Նկ. 31A2-2), ինչը նշանակում է, որ առկա հիմքային հոսքը գրեթե ամբողջությամբ ապահովվում է ցամաքային էկոհամակարգերի կողմից։
Աղյուսակ 31A2-1. Միջին ES ցուցիչի արժեքները Արմենիայի համար տարբեր սցենարների դեպքում
| Սցենար | Բազային հոսք, մմ (B) | Արագ հոսք, մմ (QF) | (B+QF) | B-ի մասնաբաժինը ընդհանուր հոսքում, % |
| Հողածածկ 2017թ | 51.97 | 97.01 | 148.97 | 34.88 |
| Հողածածկ 2023 թ | 51.28 | 98.04 | 149.32 | 34.34 |
| Բաց հողի սցենար | 3.43 | 120.22 | 123.65 | 2.78 |
| Բուսական հողերի սցենար | 3.58 | 124.96 | 128.54 | 2.78 |

Նկար 31A2-2. ES ցուցիչների քարտեզներ տարբեր սցենարների համար։ Մանրամասն քարտեզների համար տես «Երկրային ջրային արտադրություն» բաժինը WebGIS նախագիծը
Ներկայիս հողածածկույթի պայմաններում հիմքային հոսքը միջինում կազմում է ընդհանուր հոսքի 35%-ը (տարբեր ջրահավաք ավազաններում՝ 28-ից մինչև 40%): մերկ հողի սցենարի դեպքում հիմքային հոսքը կազմում է ընդամենը 3% (2-ից մինչև 4%) (Աղյուսակ 31A2-2; Նկ. 31A2-3): Այս ցուցանիշների արժեքները մարզերում մեծապես արտացոլում են դրանք համապատասխան ջրբաժանների համար (Նկ. 31A2-4):
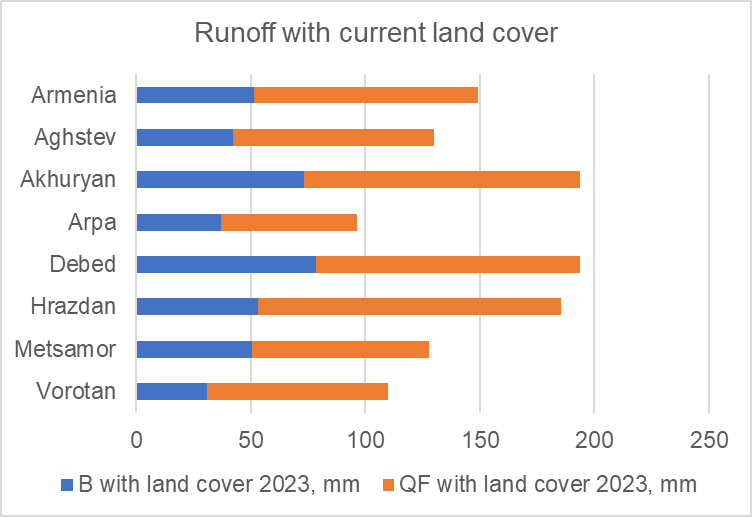

Նկ. 31A2-3. Հիմնական հոսքը և արագ հոսքը ներկայիս հողածածկույթի և մերկ հողի սցենարի պայմաններում ջրհավաք ավազաններում
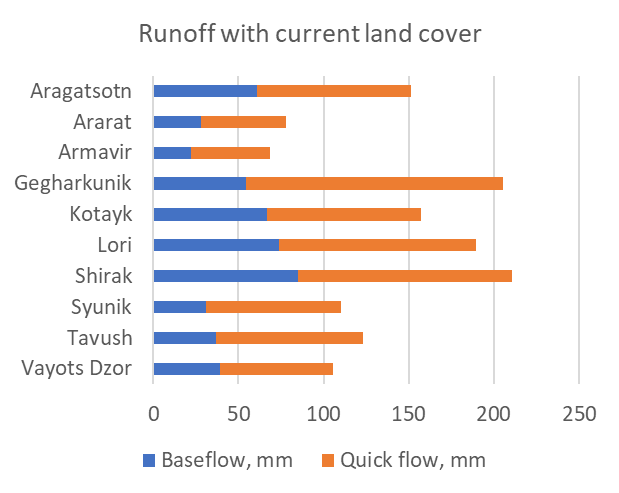
Նկ. 31A2-4. Հիմնական հոսք և արագ հոսք ներկայիս հողածածկույթի պայմաններում մարզերում
Մենք գնահատեցինք հողային բուսածածկույթի կողմից ապահովվող էկոհամակարգային ծառայությունների ծավալը՝ որպես 2023 թվականի ընթացիկ հողածածկույթի ES ցուցանիշների արժեքների և այն սցենարիոյի միջև տարբերություն, երբ բոլոր արոտավայրերն ու ծառերը փոխարինված են մերկ հողով։ Ջրահավաք ավազաններում էկոհամակարգերը ապահովում են 92%–95% հիմնական հոսք (աղյուսակ 31A2-2; նկ. 31A2-5) և նվազեցնում են արագ հոսքը 13%–36%-ով (աղյուսակ 31A2-2; նկ. 31A2-6):
Նկ. 31A2-5. Էկոհամակարգերի ազդեցությունը հիմքային հոսքի վրա: (ա) հիմքային հոսք ներկայիս հողածածկույթի պայմաններում և էկոհամակարգերի կողմից ապահովվող բաղադրիչը; (բ) էկոհամակարգերի կողմից ապահովվող հիմքային հոսքի մասնաբաժինը (%).
Նկ. 31A2-6. Էկոհամակարգերի ազդեցությունը արագ հոսքի վրա: (ա) արագ հոսք ներկայիս հողածածկույթի պայմաններում և դրա էկոհամակարգերի կողմից նվազեցված մասը; (բ) էկոհամակարգերի կողմից նվազեցված արագ հոսքի բաժինը (%).
Աղյուսակ 31A2-2. ES ցուցանիշները ներկայիս հողածածկույթի և մերկ հողի սցենարի պայմաններում ջրահավաք ավազաններում
| Ցուցանիշներ | Վորո- շագանակագույն | Մեծամոր | Հրազդան | Դեբեդ | Արփա | Ախուրյանը | Աղստեւ | Հայաստան | ||
| Հողատարածք ESRI 2023 | Բազային հոսք, մմ | Բ2023 | 31.0 | 50.4 | 53.4 | 78.3 | 37.3 | 73.2 | 42.4 | 51.3 |
| Արագ հոսք, մմ | Կիսաեզրափակիչ2023 | 79.2 | 77.5 | 132.0 | 115.6 | 59.3 | 120.7 | 87.6 | 98.0 | |
| B-ի մասնաբաժինը ընդհանուր հոսքում, % | 28.2 | 39.4 | 28.8 | 40.4 | 38.6 | 37.7 | 32.6 | 34.3 | ||
| Բաց հողի սցենար | Բազային հոսք, մմ | Բֆոն | 2.3 | 2.8 | 3.1 | 6.5 | 1.9 | 4.9 | 3.6 | 3.4 |
| Արագ հոսք, մմ | Կիսաեզրափակիչֆոն, | 104.6 | 90.7 | 149.9 | 148.2 | 80.6 | 138.1 | 117.3 | 120.2 | |
| B-ի մասնաբաժինը ընդհանուր հոսքում, % | 2.1 | 3.0 | 2.0 | 4.2 | 2.3 | 3.5 | 3.0 | 2.8 | ||
| Էկոհամակարգային ազդեցություններ | Էկոհամակարգերի ապահոված հիմնական հոսք, մմ | Բէկո= Բ2023-Բֆոն | 28.7 | 47.6 | 50.3 | 71.8 | 35.4 | 68.2 | 38.8 | 47.8 |
| Էկոհամակարգերի կողմից ապահովվող հիմնական հոսքի բաժինը, % | Բէկո*100/B2023 | 92.6 | 94.4 | 94.2 | 91.7 | 94.9 | 93.2 | 91.5 | 93.2 | |
| Էկոհամակարգերի կողմից quickflow-ի նվազեցում, մմ | Կիսաեզրափակիչէկո = կիսաեզրափակիչ2023-QFֆոն, | -25.5 | -13.2 | -17.8 | -32.6 | -21.3 | -17.4 | -29.7 | -22.2 | |
| Էկոհամակարգերի կողմից արագ հոսքի բաժինը նվազեցվել է, % | Կիսաեզրափակիչէկո* 100/ Կիսաեզրափակիչ2023, | -32.2 | -17.0 | -13.5 | -28.2 | -35.9 | -14.4 | -33.9 | -22.7 |
Աղյուսակ 3. Ստորին գետի կուտակային բազային հոսքը (Bsum) հասնում է մինչև 2023թ. փաստացի հողածածկույթը և այն սցենարը, երբ բոլոր բնական էկոհամակարգերը փոխարինվում են մերկ հողով:
| Հողածածկ, 2023 թ | Բաց հողի սցենար | Տարբերությունը Բգումար 2023-Բմերկ գումարը | բաժնեմասը Բգումար ապահովված է ցամաքային էկոհամակարգերով, % | |
| Աղստեւ | 686063872 | 53702228 | 632361644 | 92.2 |
| Ախուրյանը | 1562785152 | 82415360 | 1480369792 | 94.7 |
| Արգիչի | 75929520 | 3704933 | 72224587 | 95.1 |
| Արփա | 313119360 | 11837469 | 301281891 | 96.2 |
| Ազատ | 349204672 | 11007498 | 338197174 | 96.8 |
| Դեբեդ | 2672169472 | 179894192 | 2492275280 | 93.3 |
| Գավառագետ | 422896480 | 13807621 | 409088859 | 96.7 |
| Հրազդան | 3543649536 | 154972240 | 3388677296 | 95.6 |
| Մասրիկ | 43279976 | 1879218.75 | 41400757.25 | 95.7 |
| Մեծամոր | 1676233984 | 72298784 | 1603935200 | 95.7 |
| Վեդի | 134872176 | 6922562 | 127949614 | 94.9 |
| Ողջի | 75920344 | 4065560.75 | 71854783.25 | 94.6 |
| Որոտան | 300472096 | 15817257 | 284654839 | 94.7 |
Աղյուսակ. 2023 թվականի հողածածկույթով մարզերում միջին հիմնական հոսքը և արագ հոսքը
| Բազային հոսք, մմ | Արագ հոսք, մմ | |
| Արագածոտն | 61 | 91 |
| Արարատ | 28 | 50 |
| Արմավիր | 22 | 47 |
| Գեղարքունիք | 55 | 151 |
| Կոտայք | 67 | 90 |
| Լոռի | 74 | 116 |
| Շիրակ | 85 | 126 |
| Սյունիք | 31 | 79 |
| Տավուշ | 37 | 86 |
| Վայոց ձոր | 39 | 66 |
.
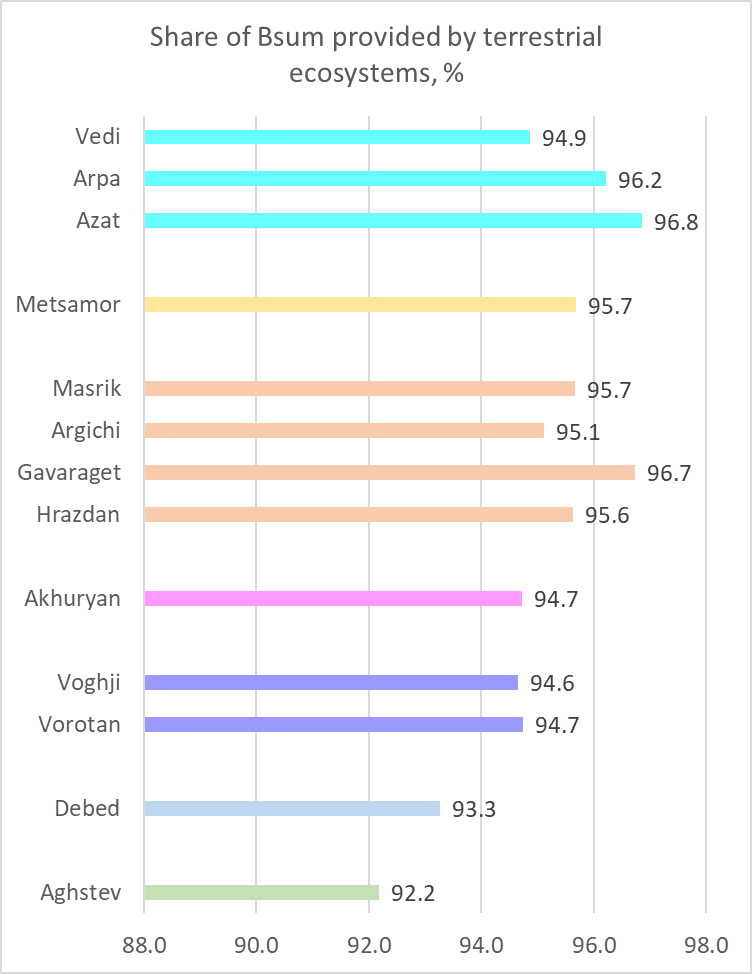
Նկար. Հիմնական հոսքի (%) բաժինը, որը ապահովվում է ցամաքային էկոհամակարգերի կողմից ջրահավաք ավազաններում և ստորին գետը հասնում է
Բուսածածկույթի գոտիներում էկոհամակարգային ծառայությունների (ES) ցուցանիշների վերլուծությունը ցույց է տալիս, որ միջին հիմնական հոսքի ամենաբարձր արժեքները հանդիպում են ալպյան և ենթալպյան գոտիներում, մինչդեռ փայտածածկ բուսականությունը ցուցաբերում է մարգագետինների տարբեր տեսակների համար բնորոշ մակարդակներ։ Մի շարք բուսածածկույթային գոտիների առանձին պոլիգոնների ներսում արժեքների տիրույթը բավականին լայն է (ալպյան, ենթալպյան, մարգագետին-ստեփ, անտառային գոտիներ և կեռասենու անտառներ (Նկ. 31A2-7a))։ Էկոհամակարգերի կողմից ներկայիս հիմքային հոսքին տրամադրվող մասնաբաժինը ամենացածրն է անտառային, ստեփային և ճահճային գոտիներում (88–89%), իսկ ամենաբարձրը (98%)՝ անապատային գոտում, ինչը պայմանավորված է միայն այն փոքր տարածքի հատուկ առանձնահատկություններով, որտեղ այն ներկայումս հանդիպում է Արմենիայում։ Մյուս բուսածածկության գոտիներում այս ցուցանիշը տատանվում է 93%-ից մինչև 96% (Նկ. 31A2-7b): 
Նկար 31A2-7. Հիմնական հոսքի ցուցիչներ բուսածածկույթի գոտիներում. Կարմիր կետերը ցույց են տալիս միջին արժեքները, իսկ գունավոր սյունակները ներկայացնում են անհատական բազմակողմանիքի արժեքների տիրույթը։
Ալպյան և ենթալպյան խոտածածկ տարածքներում հաշվարկվել են հիմնական հոսքի ամենաբարձր արժեքները (155 և 137 մմ), մինչդեռ անտառային գոտում հիմնական հոսքը կազմել է 29 մմ, որը մոտ է ստեփային գոտու ցուցանիշին (25 մմ); երկուսն էլ ցածր են կիսաանապատային և անապատային գոտիներում արձանագրված արժեքներից։ Էկոհամակարգերի կողմից ապահովվող հիմնական հոսքի մասնաբաժինը նույնպես նվազագույն է անտառային և ստեպային գոտիներում (89%): Այս հակաինտուիտիվ արդյունքը, մեր կարծիքով, բացատրվում է մի շարք գործոնների համակցված ազդեցությամբ, որոնք որոշում են հիմնական հոսքը՝ տեղումներ, տեղանքի թեքություն և հողի թափանցելիություն: Լեռնային արոտավայրերում հիմնական հոսքի շատ բարձր բացարձակ արժեքները պայմանավորված են լեռներում տեղումների մեծ քանակով: Անտառային գոտում հիմքային հոսքի ցածր արժեքները, ամենայն հավանականությամբ, պայմանավորված են նրանով, որ անտառները հիմնականում աճում են կիրճերի և լեռների կտրուկ թեքություններում։ Մեր գնահատմամբ՝ բուսածածկույթի գոտիների մեջ ամենաբարձր միջին թեքությունը հանդիպում է անտառային և կեռասենի գոտիներում՝ մոտ 20°, մինչդեռ լեռնային խոտավայրերն ու ստեփպերը զբաղեցնում են ավելի մեղմ թեքություններ՝ 10°-ից մինչև 17°, իսկ կիսաանապատներն ու միակ անապատային հատվածը գտնվում են հարթավայրերում՝ միջին թեքությամբ մոտ 6° (Նկ. 31A2-8): Կիսաանապատային գոտում 38 մմ միջին հիմքային հոսքը և դրա 94%-ը էկոհամակարգերի կողմից ապահովվելը, ամենայն հավանականությամբ, պայմանավորված է նրա տեղակայմամբ ամենափոքր ռելիեֆով և բարձր թափանցիկությամբ հողերով հարուստ տարածքներում։ Հայաստանում մնացած միակ փոքր անապատային հատվածը ցուցաբերում է միջին հիմքային հոսք՝ 34 մմ, և էկոհամակարգերի կողմից ապահովվող հիմքային հոսքի չափազանց բարձր մասնաբաժին (98%), հավանաբար այն պատճառով, որ այն ամբողջությամբ գտնվում է ամենաբարձր թափանցելիությամբ հողերում։

Նկ. 31A2-8. Բուսական գոտիների միջին թեքությունը (գոտիները պատկերման համար դասավորված են ըստ բարձրության; իրականում բարձրության բաշխումը կարող է տարբերվել)
2. ES-ը փոխվում է 2017-ից մինչև 2023 թ
Բոլոր հայտնաբերված փոփոխությունները պայմանավորված են միայն հողածածկույթի փոփոխություններով (Բաժին 2.2.B): եղանակի և կլիմայի փոփոխությունները հաշվի չեն առնվում: Քարտեզները ցույց են տալիս, որ փոփոխությունները սփորադիկ են և հակառակ ուղղված (Նկ. 31A2-9): Այնուամենայնիվ, ընդհանուր առմամբ դրանք կարելի է բնութագրել որպես բացասական: Այն դեպքերում, երբ ES ցուցանիշները զգալիորեն փոխվել են, հիմնական հոսքը (B) նվազել է, իսկ արագ հոսքը (QF) աճել է: Սա նշանակում է, որ հողային էկոհամակարգերի կարողությունը պահպանելու հիմնական հոսքը չոր շրջաններում նվազում է։ Միակ բացառությունը Արփա ավազանն է, որտեղ B-ն աճել է։ Ամենանշանակալից բացասական փոփոխությունները տեղի են ունեցել Շիրակի մարզում և Ախուրյան ջրբաժանում՝ համապատասխանելով Շիրակի մարզում հողածածկույթի փոփոխություններին։ Պատճառը Շիրակի մարզում խոտածածկ տարածքների հաշվին մշակաբույսերի տարածքների ընդլայնումն է։ (տես այստեղ).
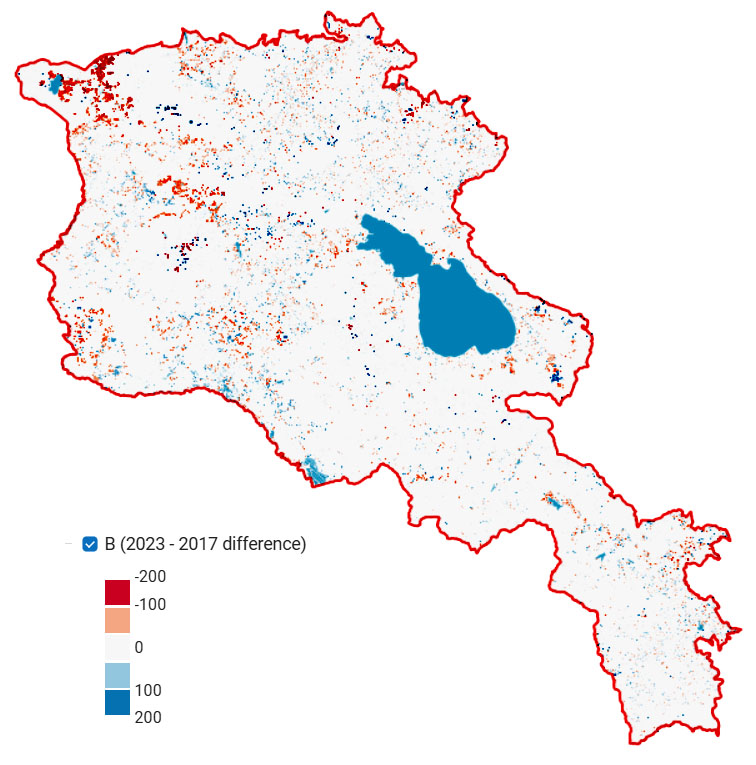
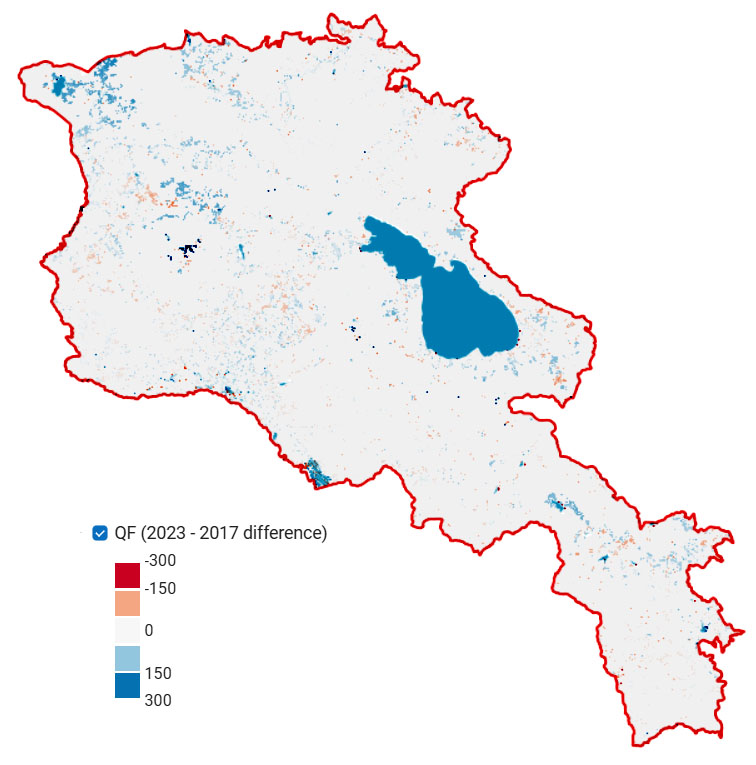
Նկար 31A2-9. Հիմնական հոսքի (ա) և արագ հոսքի (բ) փոփոխությունները 2017-ից մինչև 2023 թվականը, մմ։ Մանրամասն քարտեզների համար տես «Երկրային ջրային արտադրության սեզոնային դինամիկա» բաժինները Վեբ ԳԻՍ նախագիծը
Ջրահավաք ավազաններում և մարզերում առավել նկատելի փոփոխությունները հիմնական հոսքի նվազումն ու արագ հոսքի աճն են։ Այս բացասական փոփոխությունները առավել արտահայտված են Ախուրյան և Մեծամոր ջրահավաք ավազաններում, ինչպես նաև Շիրակ և Արագածոտն մարզերում։ Արփա և Աղստև ավազաններում, ինչպես նաև Արարատի մարզում, նկատվում է հիմնական հոսքի փոքր աճ (աղյուսակ 31A2-3; նկարներ 31A2-10 և 31A2-11):
Նկ. 31A2-10. Հիմնական հոսքի և արագ հոսքի փոփոխությունները 2017–2023 թթ. ըստ ամբողջական (ա) և հարաբերական (բ) ցուցանիշների ջրահավաք ավազաններում
Նկ. 31A2-11. Հիմնական հոսքի և արագ հոսքի փոփոխությունները 2017–2023 թվականներին՝ ըստ բացարձակ (ա) և հարաբերական (բ) ցուցանիշների մարզերում
Աղյուսակ 31A2-3. Հիմնական հոսքի և արագ հոսքի փոփոխությունները 2017–2023 թվականներին ջրահավաք ավազաններում և մարզերում
| Բազային հոսք, միջին | Արագ հոսք, նշանակում է | ||||||||
| B 2017, մմ | B 2023, մմ | B-ի փոփոխություն, մմ | B, %-ի փոփոխություն 2017թ | QF 2017, մմ | QF 2023, մմ | QF-ի փոփոխություն, մմ | QF-ի փոփոխություն, % 2017-ի համեմատ | ||
| Ջրբաժաններ | Աղստեւ | 42.1 | 42.4 | 0.2 | 0.6 | 87.3 | 87.6 | 0.3 | 0.3 |
| Ախուրյանը | 79.0 | 73.2 | -5.9 | -7.4 | 116.6 | 120.7 | 4.1 | 3.5 | |
| Արփա | 37.0 | 37.3 | 0.2 | 0.7 | 59.3 | 59.3 | 0.0 | 0.0 | |
| Դեբեդ | 78.6 | 78.3 | -0.3 | -0.4 | 114.3 | 115.6 | 1.3 | 1.1 | |
| Հրազդան | 53.5 | 53.4 | 0.0 | -0.1 | 131.4 | 132.0 | 0.6 | 0.5 | |
| Մեծամոր | 51.7 | 50.4 | -1.2 | -2.4 | 75.8 | 77.5 | 1.7 | 2.3 | |
| Որոտան | 31.0 | 31.0 | 0.0 | 0.1 | 78.6 | 79.2 | 0.5 | 0.7 | |
| գավառներ | Արագածոտն | 62.5 | 61.0 | -1.5 | -2.5 | 88.5 | 90.5 | 2.0 | 2.2 |
| Արարատ | 27.6 | 28.1 | 0.5 | 1.7 | 49.5 | 49.6 | 0.1 | 0.3 | |
| Արմավիր | 22.2 | 21.9 | -0.3 | -1.3 | 46.2 | 46.8 | 0.6 | 1.2 | |
| Գեղարքունիք | 54.6 | 54.5 | -0.1 | -0.1 | 150.5 | 151.1 | 0.6 | 0.4 | |
| Կոտայք | 66.4 | 66.7 | 0.3 | 0.4 | 89.8 | 90.3 | 0.5 | 0.6 | |
| Լոռի | 74.1 | 74.0 | -0.2 | -0.2 | 114.5 | 115.8 | 1.3 | 1.2 | |
| Շիրակ | 91.3 | 85.1 | -6.2 | -6.8 | 121.3 | 125.7 | 4.4 | 3.6 | |
| Սյունիք | 30.9 | 30.9 | 0.0 | 0.1 | 78.6 | 79.1 | 0.5 | 0.7 | |
| Տավուշ | 36.7 | 36.9 | 0.1 | 0.3 | 86.2 | 86.3 | 0.1 | 0.1 | |
| Վայոց ձոր | 39.3 | 39.4 | 0.1 | 0.3 | 66.0 | 66.0 | 0.0 | 0.0 | |
| Հայաստան | 52.0 | 51.3 | -0.7 | -1.3 | 97.0 | 98.0 | 1.0 | 1.1 | |
Ստորին հոսանքի կուտակային բազային հոսքը (Bsum) ամենաշատը նվազել է Ախուրյան գետում (-9.25%), և Մեծամոր գետում (-3.03%), մինչդեռ Ողջի գետում այն տեսանելիորեն աճել է (+5.28%)
Ստորին գետում կուտակային բազային հոսքի փոփոխությունները հասնում են 2017-ից 2023 թվականներին
| Գետեր | Բսում 2023, մմ | Bsum 2017, մմ | Փոփոխություններ, մմ | Փոփոխություններ, % համեմատ 2017 թ |
| Աղստեւ | 686,063,872 | 685,638,016 | 425,856 | 0.06 |
| Ախուրյանը | 1,562,785,152 | 1,722,085,760 | -159,300,608 | -9.25 |
| Արգիչի | 75,929,520 | 75,653,040 | 276,480 | 0.37 |
| Արփա | 313,119,360 | 309,875,328 | 3,244,032 | 1.05 |
| Ազատ | 349,204,672 | 345,485,152 | 3,719,520 | 1.08 |
| Դեբեդ | 2,672,169,472 | 2,684,654,848 | -12,485,376 | -0.47 |
| Գավառագետ | 422,896,480 | 425,799,968 | -2,903,488 | -0.68 |
| Հրազդան | 3,543,649,536 | 3,543,354,368 | 295,168 | 0.01 |
| Մասրիկ | 43,279,976 | 42,957,568 | 322,408 | 0.75 |
| Մեծամոր | 1,676,233,984 | 1,728,691,072 | -52,457,088 | -3.03 |
| Վեդի | 134,872,176 | 132,632,480 | 2,239,696 | 1.69 |
| Ողջի | 75,920,344 | 72,110,264 | 3,810,080 | 5.28 |
| Որոտան | 300,472,096 | 300,990,784 | -518,688 | -0.17 |

3. Առաքման և օգտագործման հավասարակշռություն
Քանի որ SWY մոդելով հաշվարկված հիմնական հոսքի և արագ հոսքի արժեքները, համաձայն InVEST օգտվողի ուղեցույցի, հարաբերական չափորոշիչներ են, հիմնական հոսքի ծավալը VԲ Հաշվարկվել է հետևյալ կերպ՝ VԲ=BFI⋅Vամբողջ որտեղ Vամբողջ Գետի հոսքը՝ ըստ Հայաստանի կառավարության և ARMSTAT-ի ներկայացրած տվյալների (տես ստորև աղյուսակը); BFI-ը հիմքային հոսքի ինդեքսն է՝ BFI=B/(B+QF), որտեղ B-ն և QF-ն համապատասխանաբար հիմքային և արագ հոսքերի արժեքներն են, որոնք հաշվարկվել են SWY մոդելով։
Այս վերլուծությունը մոտավոր է, քանի որ մենք օգտագործել ենք գետերի հոսքի տվյալները ըստ ջրահավաք ավազանների և ջրօգտագործման տվյալները ըստ մարզերի։ Մարզերի և ջրահավաք ավազանների սահմանները մեծապես համընկնում են, ինչը թույլ է տալիս նման մոտավոր գնահատական։ Այն ջրահավաք ավազանների համար, որոնք ընդգրկում են երկու մարզ, տվյալները այդ մարզերի համար գումարվել են։ Անշուշտ, ապագայում հավասարակշռությունը պետք է կատարելագործվի նույն EAAs-ների տվյալների օգտագործմամբ։
| Ջրբաժան | Գետի հոսք, միլիոնավոր խորանարդ մետր | Տվյալների աղբյուր | Մանրամասներ |
| Աղստեւ | 260 | ArmStat տարածաշրջանային վիճակագրության ձեռնարկներ 2023 https://armstat.am/en/?nid=651 | – |
| Ախուրյանը | 700.7 | Բասինի կառավարման պլան https://www.arlis.am/hy/acts/112336 | Գետի հոսքը հաշվարկվել է որպես օգտագործելի գետի հոսքի (506.2) և բնապահպանական հոսքի (194.5) գումար։ |
| Արփա | 1177.0 | Բասինի կառավարման պլան https://www.arlis.am/hy/acts/112336 | Ազատ, Վեդի և Արփա գետերի հոսքերի գումարը |
| Դեբեդ | 960 | ArmStat տարածաշրջանային վիճակագրության ձեռնարկներ 2023 https://armstat.am/en/?nid=651 | – |
| Հրազդան | 712.2 | Բասինի կառավարման պլան https://www.arlis.am/hy/acts/171449 | – |
| Մեծամոր | 777.8+265.5=1043.3 | Բասինի կառավարման պլաններ https://www.arlis.am/hy/acts/171449 https://www.arlis.am/hy/acts/112336 | Գետի ընդհանուր հոսքը հաշվարկվել է որպես Qasagh (265.5) և Metsamor (777.8) գետերի հոսքերի գումար։ Մետսամոր գետի հոսքը հաշվարկվել է որպես օգտագործելի հոսքի (1,786.7) և բնապահպանական հոսքի (106.0) գումար՝ բացառելով Արաքսի և Ախուրյանի գետերի միախառնման ստորին հատվածում հասանելի ջուրը (1,114.9): |
| Որոտան | 1319.6 | Բասինի կառավարման պլան https://www.arlis.am/hy/acts/106124 | Հարավային BMA-ի գետերի հոսքերի գումար |
Ջրի սպառման ճնշող մեծամասնությունը բաժին է ընկնում գյուղատնտեսության, ձկնորսության և անտառային տնտեսության ոլորտին, ինչը ընդգծում է հիմնական հոսքի ապահովման էկոհամակարգային ծառայության գնահատման կարևորությունը։ Մետսամոր և Արփա ջրահավաք ավազաններում գյուղատնտեսական ջրօգտագործումը գերազանցում է հիմնական հոսքի ծավալը (Նկ. 31A2-12a): Մետսամորի և Արփայի ավազաններում հիմնական հոսքը համապատասխանաբար ապահովում է գյուղատնտեսական ջրօգտագործման 561 TP3T-ը և 551 TP3T-ը; Հրազդանի ավազանում հիմնական հոսքը մի փոքր գերազանցում է գյուղատնտեսական ջրօգտագործումը՝ 161 TP3T-ով: Մյուս ավազաններում հիմնական հոսքը բազմակի անգամ գերազանցում է ջրօգտագործումը (Նկ. 31A2-12c): Վերլուծության մեջ օգտագործված Տավուշի մարզի ջրօգտագործման տվյալները վերաբերում են տարածքի, որը ավելի մեծ է, քան Աղստև գետի ավազանը, որի համար առկա են գետային հոսքի տվյալներ։ Ուստի իրականում ամբողջ տարածքից ստացվող գետային հոսքը ջրօգտագործումը գերազանցում է ավելի մեծ չափով, քան ցույց են տալիս այս արդյունքները։
Նկար 31A2-12. ES-ի մատակարարման և սպառման հավասարակշռություն: (ա) գետի հոսք, հիմքային հոսք և ջրի սպառում ջրահավաք ավազաններում (* տվյալները ներկայացված են ARMSTAT-ի և կառավարության կողմից); (բ) Բազային հոսքի ծավալը և գյուղատնտեսությունում, ձկնորսությունում և անտառային տնտեսությունում ջրի սպառման միջև տարբերությունը; (ս) Գյուղատնտեսության, ձկնորսության և անտառային տնտեսության ջրօգտագործման մեջ հիմնական հոսքի բաժինը (%).
Աղյուսակ 31A2-5. ES-ի մատակարարման և օգտագործման հավասարակշռություն
| Ջրի օգտագործումը գյուղատնտեսությունում, ձկնաբուծությունում, անտառային տնտեսությունում*, միլիոնավոր մ3 | Ընդհանուր ջրի սպառում*, միլիոն մ³3 | Բազային հոսք, միլիոնավոր մ3 | Գետի հոսք*, միլիոններ մ3 | Գյուղատնտեսությունում, ձկնորսությունում և անտառային տնտեսությունում հիմքային հոսքի ծավալին և ջրի սպառման միջև տարբերությունը, միլիոն խորանարդ մետր3 | Գյուղատնտեսության, ձկնորսության և անտառային տնտեսության ջրօգտագործման մեջ հիմքային հոսքի մասնաբաժինը (%) | |
| Աղստև (Տավուշի մարզի մի մաս) | 11.10 | 20.90 | 84.78 | 260.00 | 73.68 | 763.78 |
| Ախուրյան (Շիրակի մարզ) | 53.00 | 63.10 | 264.46 | 700.70 | 211.46 | 498.99 |
| Արփա (Արարատի և Վայոց Ձորի մարզեր) | 820.30 | 835.90 | 454.50 | 1177.00 | -365.80 | 55.41 |
| Դեբեդ (Լոռի մարզ) | 3.00 | 18.00 | 387.69 | 960.00 | 384.69 | 12923.03 |
| Հրազդան (Կոտայք և Գեղարքունիք մարզեր) | 176.10 | 218.60 | 205.13 | 712.20 | 29.03 | 116.49 |
| Մեծամոր (Արմավիրի և Արագածոտնի մարզեր) | 740.40 | 769.10 | 411.06 | 1043.30 | -329.34 | 55.52 |
| Վորոտան (Սյունիքի մարզ) | 6.00 | 89.50 | 371.51 | 1319.60 | 365.51 | 6191.75 |
Տվյալները ներկայացված են ARMSTAT-ի և Հայաստանի կառավարության կողմից։
4. Կրթության փոքր կողմնակի արտադրանք
Սեզոնային ջրաբերություն մոդուլը պահանջում է տվյալներ Հայաստանի տարածքում ամսական տեղումների բաշխման վերաբերյալ: Այնուամենայնիվ, մոդուլը հաշվի չի առնում ձյան ժամանակահատվածը, երբ ձյունը չի հալվում, և, հետևաբար, հեղուկ տեղումներ չկան: Այս խնդրի լուծման համար մենք հաշվարկել ենք Հայաստանում հեղուկ տեղումների քանակը ամիսներով։ Ի լրումն մոդելում օգտագործելու, այս արդյունքները կարող են օգտակար լինել Հայաստանի կլիմայական բնութագրերը ավելի լայն լսարանի բացատրելու համար:
Հղումներ
Hamel, P., Valencia, J., Schmitt, R., Shrestha, M., Piman, T., Sharp, RP, Francesconi, W., & Guswa, AJ (2020): Լանդշաֆտի կառավարման համար սեզոնային ջրի բերքատվության մոդելավորում. կիրառություններ Պերուում և Մյանմարում: Բնապահպանական կառավարման ամսագիր, 270, 110792. https://doi.org/10.1016/j.jenvman.2020.110792