1. Introduction: the aim and general methodology of the project
1.1. Aim of the project
The aim of the project is to create a Prototype of national ecosystem accounting (EA) for natural terrestrial ecosystems of Armenia in physical terms, in accordance with the System of Environmental-Economic Accounting framework (SEEA EA) (United Nations, 2021), and to provide technical recommendations for initiating physical EA in Armenia.
The project is being implemented by Biodiversity Conservation Center BCC Armenia jointly with the Leibniz Institute of Ecological Urban and Regional Development (IOER) with the participation of experts from leading scientific organizations in Armenia. The project is funded by the German Federal Environment Ministry’s Advisory Assistance Program (AAP) for environmental protection in the countries of Central and Eastern Europe, the Caucasus and Central Asia and other countries neighboring the European Union. It is supervised by the Federal Agency for Nature Conservation (BfN) and the German Environment Agency (UBA). The project is carried out in Armenian and English languages.
1.2. System of Environmental-Economic Accounting—Ecosystem Accounting
(SEEA EA)
Sustainable development is impossible without an understanding of ecosystems, the services that they provide to humans, and the changes they undergo. This challenge is addressed by EA, which has been rapidly evolving in recent years. In 2024, 94 countries conducted accounting—to varying extents—under SEEA Central Framework (SEEA CF) and 53 countries also compile the SEEA Ecosystem Accounting (SEEA EA) and/or thematic accounts. [SEEA Global assessment, 2024][1]. In particular, the INCA project has launched a pilot EA for EU countries [European Commission, 2021].
The EA constitutes a statistical framework for organizing data about ecosystems and ecosystem services, tracking changes in them. EA data are needed for the following tasks: to make visible and understandable to people the material and non-material contribution of living nature to their well-being; to assess and track the state of ecosystems and their services; to identify and track the impact of human activities on the state of ecosystems and their services; to provide an information basis for decision-making in order to maintain and sustainably use ecosystems and ecosystem services.
The SEEA EA is built on a few core accounts (Figure 1-1):
1. Ecosystem extent (EE) accounts record the size of ecosystems of different types and changes in it. Ecosystem extent is usually measured in terms of spatial area but may also be measured in terms of length or volume. Ecosystem extent is accounted for within ecosystem accounting areas (EAAs)—e.g., a nation, province, river basin, or protected area—by ecosystem type.
2. Ecosystem condition accounts record the condition of ecosystems and the changes in it providing valuable information on the health of ecosystems.
3. & 4. Ecosystem services (ES) accounts (physical and monetary) record the supply of ES by ecosystems and the use of those ES by economic units, including households.
5. Monetary ecosystem asset accounts record on stocks and changes in stocks of ecosystem assets.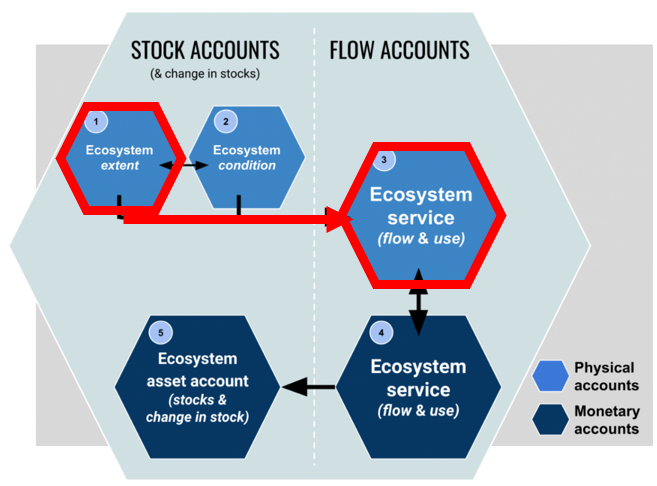
Figure 1-1. Ecosystem accounts and how they relate to each other (https://seea.un.org/ecosystem-accounting). Accounts included in the project are highlighted in red.
1.3. Ecosystem accounting in Armenia
Currently, Armenia is among the 94 countries that apply the SEEA Central Framework and among the 67 countries that publish at least one account on a regular basis (Stage III)[2]. As indicated by the 2024 SEEA Global Assessment[3] Armenia compiles water accounts—specifically, physical and monetary supply-and-use tables for water[4] — which are published on the website of Statistical Committee of the Republic of Armenia (ArmStat)[5]
As stated on the SEEA website, as of 2024 Armenia has not yet begun compiling ecosystem accounts. Nevertheless, important steps toward ecosystem accounting have already been taken, both at the government level and by Armenian scientific community.
The Decision of the Government of the Republic of Armenia in April 11, 2019 n 431-n[6] “On approval of the procedure for classification of the land cover of the Republic of Armenia” set out the framework for the annual accounting of the areas of the main land-cover classes in Armenia, based on the results of current land accounting in communities, marzes (provinces), and nationwide. Accounts should be compiled for the following land-cover classes: Cultivated lands; Grasslands; Tree-covered areas; Shrub-covered areas; Water covered areas; Vegetation-free areas. Since then, statistical data on the areas of these land-cover classes have been publicly available at the marz level and for Armenia as a whole (see Section 2.2). Annual accounting of land-cover class areas is a fundamentally important step toward ecosystem accounting. However, for a modern, comprehensive accounting of ecosystems—as carriers of biodiversity and providers of ecosystem services—it is necessary to have not only statistical tables but also digital maps, which are not yet available for the entire territory of Armenia.
In recent years, attention to Armenia’s ES has been increasing [Shahnazaryan, Harutyunyan, 2017], including water-regulating ES [Introduction…, 2011], soil erosion prevention [GIZ EcoServe Project, 2014; 2016; Pietsch et al., 2019] and cultural ES [Asatryan et al., 2024; Pietsch et al., 2019]. However, quantitative assessment and mapping of ES at the national level in Armenia have not yet been carried out.
1.4. EA Prototype Version 1
The EA Prototype Version 1 (EA PV1) follows the recommendations of SEEA-EA (United Nations, 2021) and the European INCA project on ecosystem accounting (Eurostat, 2024 a,b; Vallecillo et al., 2019) and covers physical EE and ES account (highlighted in red in the Figure 1.2-1). Monetary accounts are not included in the project. The EA PV1 includes statistical tables and maps presenting EE and ES indicators, as well as a short description of the main results, data sources used, the assessment methodology.
The EA PV1 was created based on currently available data – published open statistical, cartographic and scientific data for Armenia, as well as global databases. The project did not include the collection of primary data or specialized scientific research. In cases where national data is not available, the assessment was made based on global databases or expert estimates. Therefore, EA PV1 presents a simplified version of EA, including only those components that could be assessed within the project framework using available open global and national data. Nevertheless, EA PV1 demonstrates the main approaches to EE and ES accounting, including examples of accounting tables in the UN-recommended format.
Natural terrestrial ecosystems are understood as all areas excluding anthropogenic areas that are created and managed by humans — namely, built-up areas and cropland. Water bodies and aquatic ecosystems were excluded from the analysis because the factors determining their condition and dynamics differ significantly from those affecting terrestrial ecosystems. Agroecosystems on cultivated lands and ecosystems within settlements were excluded from the accounts. Yerevan was also excluded from the accounts and only marzes were involved in marz level.
EE and ES accounts were compiled for the following ecosystem accounting areas (EAA):
– At the national and marz levels, using Armenia’s national and marz boundaries from the Interactive Forest Atlas of Armenia[7] website;
– Main watersheds [HydroSHEDS],
– Landscape zones [Forest Atlas of Armenia];
– Vegetation zones based on the map produced under the project (Section 2.3)
– For methodological purposes, we also developed sample EE and ES accounts for Armenia’s protected areas (PAs) (Sections 2.6 and 3.1.D).
To map and assess EE and ES we used the 10 m-resolution ESRI land cover dataset to exclude built-up areas and cropland from the accounts, as well to delineate forest and non-forest areas. The ESRI land-cover dataset was selected as an EA component following tests of several land-cover datasets, which indicated that ESRI data closely align with state statistics on agricultural areas in Armenia and enable us to demonstrate the dynamics of ecosystem extent and ES (Section 2.1). To demonstrate the ability of the EA Prototype to track changes in ecosystem extent and ES, we selected two reference years—2017 and 2023—based on the ESRI land cover dataset.
For data preprocessing, EE and ES mapping, and GIS analysis we used the open source QGIS application [QGIS] and custom Python scripts. For assessing and mapping water-related regulating services, we used models from the InVEST GIS tool (Section 3.1.A).
Ecosystem extent
At present, Armenia lacks a detailed, regularly updated digital ecosystem map. Therefore, to support an informed choice of the most suitable EE accounting methodology, we tested the feasibility of compiling EE accounts using different approaches to ecosystem classification:
– The most generalized division of ecosystems by land-cover classes, that is, accounting for the extent of natural land-cover classes (Section 2.2);
– Types of natural vegetation (Section 2.3)
– Types of natural landscapes (Section 2.4);
– Intersections of landscape zones land cover classes (LLCC) as a proxy of terrestrial ecosystems (Section 2.5).
SEEA EA recommends compiling national ecosystem accounts in accordance with the national ecosystem classification. Accordingly, we used the classification of landscape and vegetation zones adopted by the academic community of Armenia. Subsequently, all results can be reclassified into the SEEA-approved IUCN GET system level 3 for the purpose of international comparison (Section 2.3.A).
The source land cover maps were provided as raster data in GeoTIFF format, while the layers of climatic, landscape, and vegetation zones were delivered as vector data in GeoPackage format. To combine these data, first, the vector maps were rasterized in QGIS to match the coordinate reference system, spatial extent, and resolution of the land cover rasters, ensuring all maps shared the same pixel-wise structure. Next, the resulting raster maps with zonal boundaries were combined with the land cover raster maps through two steps: (i) the pixel values of the land cover map were multiplied by 100, and (ii) these adjusted values were added to the corresponding pixel values of a zonal map, resulting in a unified raster. For example, a final pixel value of 204 indicates that the pixel has a land cover value of two (e.g., trees) and a landscape value of four (e.g., low and middle mountain forest). This combined raster was then analyzed using a vector layer containing marz of watershed borders. The Zonal Histogram tool in QGIS was employed to count the occurrences of each unique raster value within the polygonal zones of the marzes or watersheds. The output layer, which contained statistics on the number of pixels with unique raster value within each marz or watershed, was exported in tabular format for further statistical analysis.
The area was calculated based on an average pixel size of 100 m². The mismatch between the total area of the country and marzes derived from land cover data and the official figures is due to discrepancies in the boundaries of the digital maps used, as well as unaccounted variation in pixel area caused by terrain across Armenia. These discrepancies should be addressed in the development of a national ecosystem extent accounting in Armenia.
SEEA EA recommends annual accounting of ecosystem extent. However, in Armenia, according to the Decision of the Government of the Republic of Armenia in April 11, 2019 n 431-n, annual data collection is currently established only for statistics on the areas of land-cover classes, without publicly accessible digital maps (see Section 2.2.A). Therefore, for methodological purposes—and to demonstrate ability of EA to track ecosystem dynamics—we used ESRI Land Cover data for 2017 and 2023.
Also, we could not fully comply with the SEEA-EA recommendations to distinguish changes in ecosystem extent between managed and unmanaged changes because of the lack of data. However, for a substantial share of the land-cover changes detected by the ESRI land cover data—specifically the expansion of cropland and built area—it is evident that these are managed changes. Therefore, in the final accounting tables, this driver is indicated for these cases; for the other cases, the driver is recorded as “not determined.”
EE account by economic units was made for marzes.
Transition matrices (change matrices) were produced on the base of GIS-analysis for both land-cover classes and vegetation types. The land-cover class matrix directly captures class-to-class transitions between the ESRI 2017 and 2023 datasets. The vegetation-type transition matrix also shows how areas of vegetation zones transited into land-cover classes (e.g., steppe vegetation converting to croplands, built-up, bare ground, or tree cover, and vice versa). Zone-to-zone vegetation transitions are not recorded in EA PV1, because the zone boundaries did not change.
Ecosystem services
In the SEEA-EA [United Nations, 2024], ES are understood as the contributions of ecosystems to benefits used in economic and other human activities. Final ES are those in which the user of the service is an economic unit; thus, every final ES represents a flow between an ecosystem asset and an economic unit. Intermediate ES are those in which the user is an ecosystem asset and there is a connection to the supply of final ES. Benefits are the goods and services that are ultimately used and enjoyed by people and society. As applied in ecosystem accounting, a benefit will reflect a gain or positive contribution to well-being arising from the use of ecosystem services.
The EA PV1 accounts for 13 final ES across all final ES categories: provisioning, regulating, recreational and intangible (Table 1.4-1). We did not consider intermediate ES. The full list of ES mentioned in SEEA–EA is presented in Table 1.4-2.
Table 1.4-1. List of ES asessed in the EA PV1
The EA PV1 focuses on the natural conditions and processes underpinning ES provision, while excluding societal factors of ES supply and use, ecosystem management and other labor and resource inputs associated with ES supply and use, ES import-export, as well as ES contributions to the System of National Accounts.
The SEEA EA terminology concerning ES volume provided by ecosystems differs slightly from that commonly used in literature. In much of the ES literature, the term supply is used to refer to an ecosystem’s potential or capacity to supply ES irrespective of use. In the SEEA-EA framework, ES physical accounts record the supply of ES by ecosystems and the use of ES by economic units (businesses, governments and households). ES are recorded as flows between ecosystem assets and economic units. The measures of supply and use are equivalent and will be equal to the actual flow between the ecosystem asset and people. In other words, the total volume of ES supplied by different ecosystems equals the total volume of ES used by different users. These indicators show how ES produced by different ecosystems are redistributed among different users. However, they do not reveal management-relevant aspects — such as the degree of ES use (including overuse and the potential to scale up use), or the extent to which the existing ES flow meets demand. These aspects can be assessed on the base of ecosystem potential to provide ES (capacity) which is understood as the ability of an ecosystem to generate an ES at the highest yield or use level that does not negatively affect the future supply of the same or other ES from that ecosystem. SEEA EA proposes keeping separate accounts for ecosystem capacity. INCA project proposes to include in accounting tables indicators of ES potential (capacity), ES demand, actual ES flow which is equal to ES supply-use, and unmet demand (Vallecillo et al., 2019).
Given the pivotal importance of the ecosystem potential (capacity) indicator for ecosystem management, we adopted it in PV 1 as the primary basis for ES assessment. Ecosystem potential can be evaluated from natural factors and the biological characteristics of ecosystems. Such data were available for all 12 ES assessed quantitatively or by scoring (the exception is the ES “biodiversity value for Armenia’s culture,” which we only described with examples). The ecosystem potential (capacity) is relevant both for ES that can be overused (provisioning and recreational services) and for regulating ES, which cannot be directly overused but may be insufficient to meet human demand. The capacity was assessed for the remaining 12 ES (Table 1.4-2).
Table 1.4-2. List of ES from SEEA EA, with those included in the EA PV1 highlighted in bold italics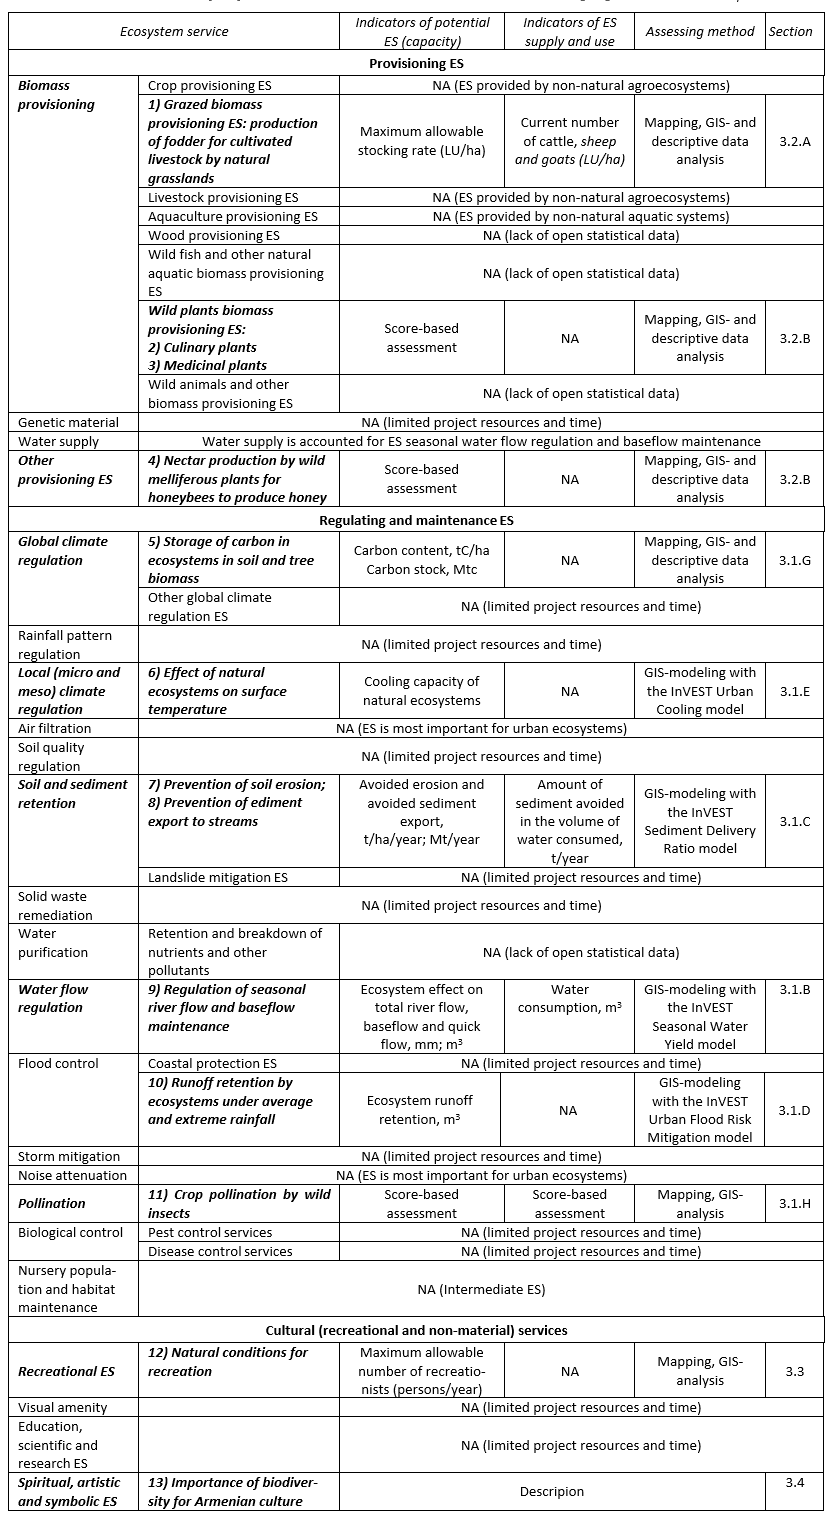
The assessment of ES use requires socio-economic data, which was available for only six ES. In four cases the ES users (economic units) were the marzes for the grazed biomass production ES (ES 1 in Table 1-1), two water-regulating ES (ES 8 and 9), and pollination (ES 11); in one case—settlements for the ecosystems’ cooling effect (ES 6); and in one case—Protected Areas for the ES of natural conditions for hiking in PAs (ES 12). Benefits derived from assessed ES are described in Table 1.4-3.
Table 1.4-3. Initial logic chains for assessed ES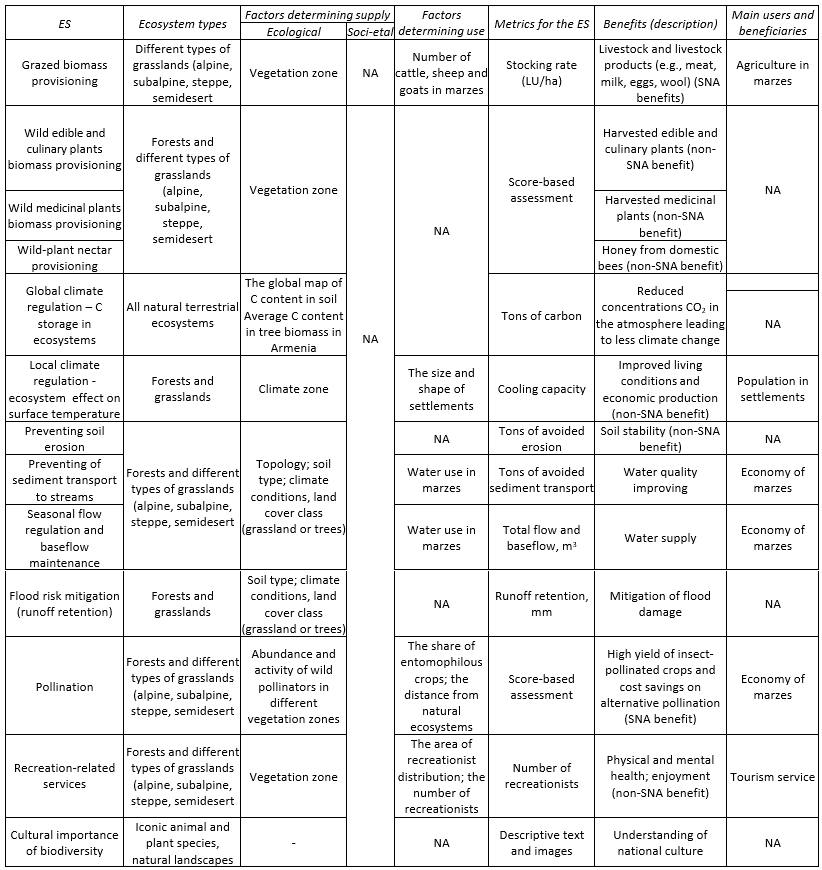
Changes in ES were assessed only in terms of their potential/capacity, based on land-cover changes between 2017 and 2023. The effects of climate change were not taken into account. An assessment of changes in ES use and supply was not conducted because data on ES use for 2017 are unavailable.
To determine ES volume provided by ecosystems, we proceeded from the following understanding of baseline conditions — situations in which ecosystems are absent and ES is not performed (Table 1.4-4). For most ES, it was assumed that in the absence of ecosystems ES would be entirely absent (no/zero ES). For water-related regulating ES, which are partly performed by the bare land surface without living cover, the baseline conditions were represented by a “bare ground” scenario, where all natural ecosystems were replaced with bare ground (see Section 3.1.A).
Table 1.4-4 Baselines for assessed ES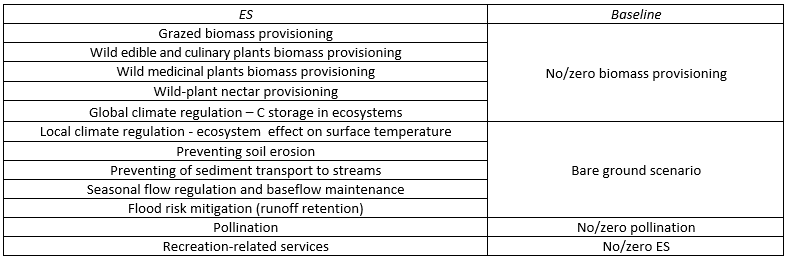
Changes in ES were assessed using two approaches:
– for ES modelled in InVEST, changes were calculated as differences between ES indicator values derived from maps based on land cover data for 2017 and 2023;
– for all ES, indicators were first assigned to each ecosystem type, after which changes in total ES values at the marz and national levels were estimated based on changes in the extent of land cover classes (Section 2.2.B) and ecosystems (Section 2.3.C) between 2017 and 2023.