We apologize for possible errors in the machine translation of the site
2.2. Extent of land cover classes in Armenia
GIS modeling and analysis – Eduard Kazakov (NextGIS OÜ, Estonia)
Analysis and presentation of results – Elena Bukvareva (BCC-Armenia)
Search for government data – Armen Grigoryan (BCC Armenia)
2.2.A. Extent of land cover classes reported by Government of Armenia
The Decision of the Government of the Republic of Armenia in April 11, 2019 n 431-n “On approval of the procedure for classification of the land cover of the Republic of Armenia” defined the following land cover classes for national accounting:
– Cultivated lands
– Grasslands
– Tree-covered areas
– Shrub-covered areas
– Water covered areas
– Vegetation-free areas
Table 1. Land cover of the Republic of Armenia 2974258.8 ha area, by classes, 2020-2024
| Land cover classes | As of July 1, 2020 | As of July 1, 2021 | As of July 1, 2022 | As of July 1, 2023 | As of July 1, 2024 |
| Cultivated lands | 538361.22 | 538580.09 | 538930.12 | 538919.19 | 539620.52 |
| Grasslands | 1366386.896 | 1371066.28 | 1370749.11 | 1370618.62 | 1363686.44 |
| Tree-covered areas | 400522.06 | 400375.84 | 400279.49 | 382109.06 | 382361.15 |
| Shrub-covered areas | 34200.612 | 34193.77 | 34135.56 | 34124.48 | 34374.33 |
| Water covered areas | 151491.8 | 153889.698 | 153890.39 | 172088.29 | 172117.81 |
| Vegetation-free areas | 483295.83 | 476152.342 | 476274.17 | 476398.959 | 482098.73 |
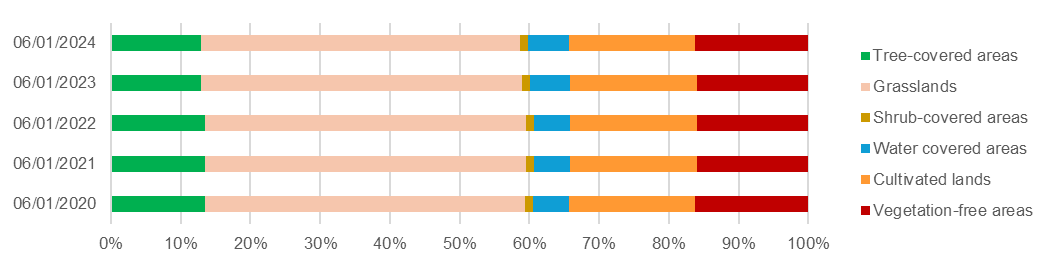
Figure 1. The share of land cover classes in Armenia by Government-reported data
These data are sufficient to fill in the accounting table in the SEEA EA-recommended format only partially (Table 2) since only data on the opening and closing extent are availablе (rows 1 and 9). From these data, the net change in areas is calculated (row 8). Data on gross expansion and reduction in the areas of land cover classes, which may offset each other (rows 2 and 5), as well as a breakdown of change drivers into managed and unmanaged (rows 3,4 and 6,7), are not available.
Table 2. Accounting table of land-cover class extent for 2020 and 2024, based on government-reported data, ha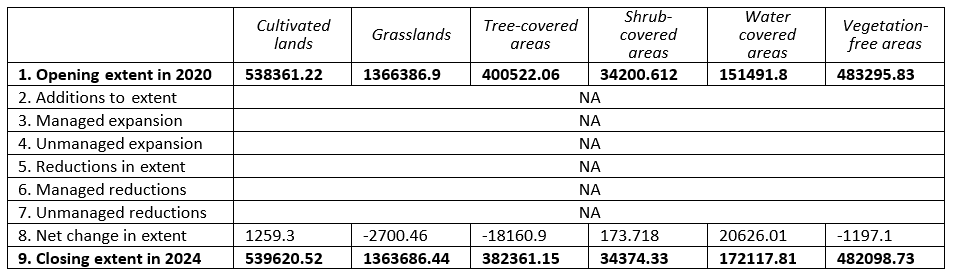
The more detailed disaggregation of land cover classes by land fund categories provided in the Government-reported data, enables the separation of vegetation-free anthropogenic areas, i.e., built-up areas from natural ones and makes it possible to compare Governmental data and land cover datasets (see here). The result with reclassified vegetation-free areas for Armenia and across marzes is shown un Table 3 and Fig.2.
How to classify grasslands and cultivated lands located within settlement boundaries is a question that needs to be addressed in order to harmonize satellite-based land cover classifications with official land cover statistics. At this stage of the analysis, we kept these lands within grasslands and cultivated lands, respectively.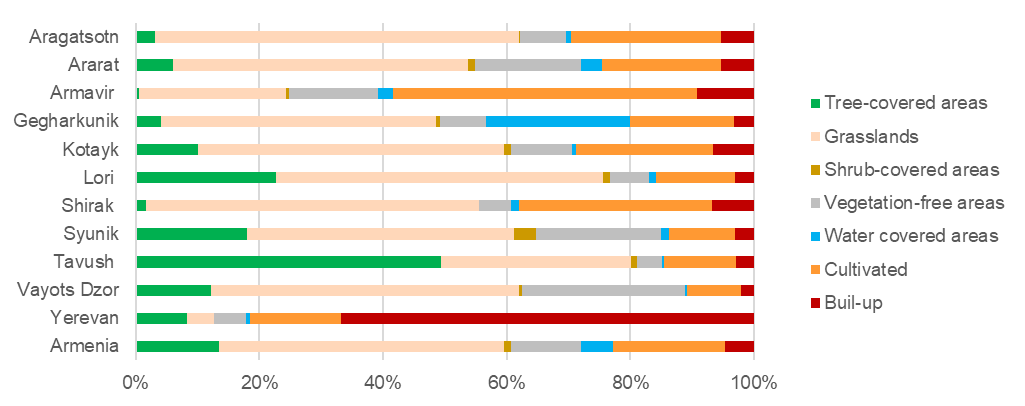
Figure 2. The share of land cover classes in Armenia and across marzes by Government-reported data
Table 3. Land cover class extent by marzes in 2022 by Government-reported data, ha
| Tree-covered areas | Grasslands | Shrub-covered areas | Vegetation-free areas | Water covered areas | Cultivated | Buil-up | |
| Aragatsotn | 8571.9 | 163313.3 | 392.5 | 20565.3 | 2189.9 | 67143.7 | 15095.6 |
| Ararat | 12724.74 | 99272.39 | 2496.22 | 35572.84 | 7090.2 | 40224.09 | 11061.98 |
| Armavir | 582.41 | 29283.57 | 634.13 | 17666.4 | 3010.438 | 60572.6 | 11345.59 |
| Gegharkunik | 21889.88 | 238054.4 | 3635.07 | 39933.93 | 124010.7 | 90318.54 | 17289.28 |
| Kotayk | 20810.43 | 102757.6 | 2313.48 | 20405.93 | 1661.12 | 45813.84 | 13820.73 |
| Lori | 86365.8 | 200387.6 | 4830.7 | 23510.69 | 4751.58 | 48300.81 | 11717.3 |
| Shirak | 4598.8 | 144403.9 | 0 | 13622.23 | 3427.13 | 83846.24 | 18128.89 |
| Syunik | 80905.01 | 194761.5 | 15742.25 | 91253.96 | 5576.07 | 47958 | 14345 |
| Tavush | 133659.9 | 82690.46 | 2943.31 | 10681.01 | 1094.24 | 31359.26 | 7970.77 |
| Vayots Dzor | 28325.5 | 114823.3 | 1147.9 | 60825.9 | 923.4 | 20109.42 | 4857.7 |
| Yerevan | 1845.1 | 1001.2 | 0 | 1133.29 | 155.61 | 3283.62 | 14909.08 |
| Armenia | 400279.5 | 1370749 | 34135.56 | 335171.5 | 153890.4 | 538930.1 | 140541.9 |
Sources:
(2021) http://www.irtek.am/DOCUMENTS/PDF/148034_havelvac.pdf
(2021) https://faolex.fao.org/docs/pdf/arm209550.pdf
(2022) http://www.irtek.am/views/act.aspx?aid=156501
(2022) https://www.arlis.am/DocumentView.aspx?DocID=171671
(2023) https://www.e-draft.am/projects/6427/about
(2024) https://www.e-draft.am/projects/7902/about
2.2.B. Extent of land cover classes by ESRI data
Since the ESRI land cover dataset was selected for use in the project, the subsequent extent assessment was conducted by ESRI data вased on the area of 1 pixel equal to 100 m2. The extent of different land cover classes according to the other datasets can be found here. The area of Lake Sevan and the administrative area of Yerevan were excluded from the extent assessment.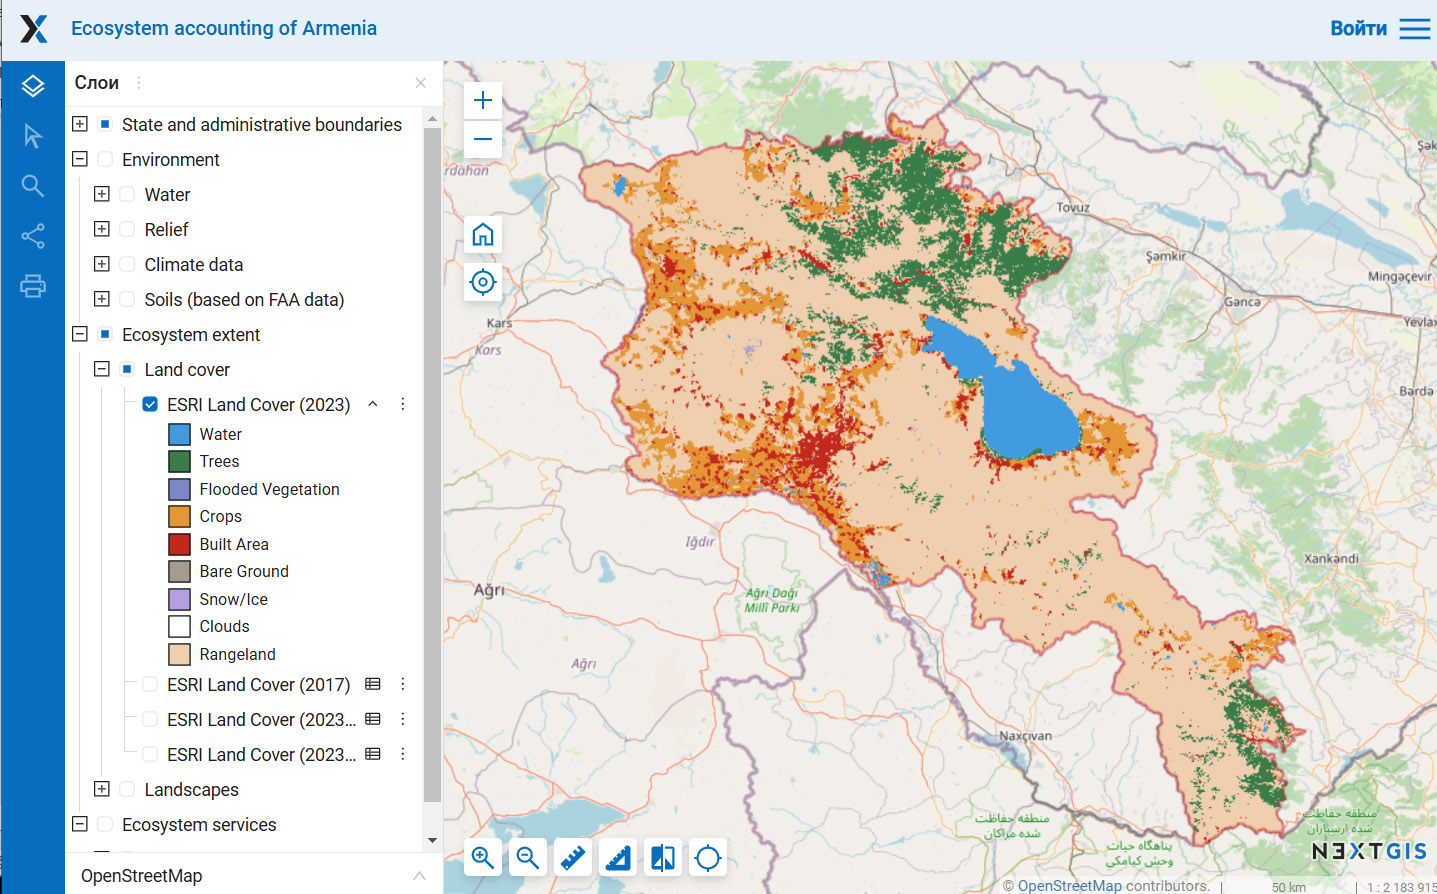
Figure 3. ESRI dataset for the territory of Armenia. For detailed maps see sections “Ecosystem extent – Landcover” here
Extent of land cover classes at the national, marz, and watershed levels
The majority of Armenia’s territory is covered by grasslands (68% аccording to ESRI data), forests occupy 11% (compared to 13% according to Government data), croplands and built-up areas account for 12% and 5%, respectively. The most human-transformed marz is Armavir, where croplands and built-up areas together make up over 60% of the territory. The least transformed marzes are Vayots Dzor, Tavush, and Syunik. Forests cover the largest area in Tavush (around 50%), and are also widespread in Lori, where they exceed 20% of the territory.
Table 4. Area of land cover classes in 2017, km2
| Rangeland | Trees | Bare Ground | Snow/Ice | Flooded vegetation | Water | Crops | Built Area | Total | |
| ARAGATSOTN | 2,161.08 | 52.54 | 12.60 | 0.02 | 0.00 | 3.43 | 380.13 | 126.33 | 2,736.12 |
| ARARAT | 1,522.66 | 30.47 | 16.35 | 0.01 | 11.71 | 29.16 | 359.92 | 144.64 | 2,114.91 |
| ARMAVIR | 455.53 | 2.84 | 5.45 | 0.00 | 1.81 | 6.67 | 645.14 | 146.25 | 1,263.70 |
| GEGHARKUNIK | 3,320.37 | 134.93 | 19.08 | 0.04 | 1.40 | 1,274.09 | 315.10 | 182.98 | 5,248.00 |
| KOTAYK | 1,506.57 | 171.74 | 7.47 | 0.74 | 0.01 | 2.49 | 270.63 | 155.14 | 2,114.80 |
| LORI | 2,558.39 | 869.51 | 4.55 | 0.02 | 0.44 | 2.64 | 189.21 | 138.24 | 3,763.00 |
| SHIRAK | 1,998.79 | 13.08 | 4.31 | 0.00 | 0.07 | 27.21 | 537.55 | 137.61 | 2,718.63 |
| SYUNIK | 3,571.06 | 634.26 | 33.14 | 0.13 | 0.04 | 17.98 | 170.64 | 66.09 | 4,493.35 |
| TAVUSH | 1,234.28 | 1,304.10 | 1.34 | 0.00 | 0.00 | 4.00 | 91.52 | 91.00 | 2,726.24 |
| VAYOTZ DZOR | 2,157.65 | 47.10 | 14.01 | 0.02 | 0.01 | 2.76 | 35.26 | 39.74 | 2,296.54 |
| ARMENIA | 20,549.27 | 3,261.03 | 119.68 | 0.97 | 15.47 | 1,371.25 | 3,018.23 | 1,372.59 | 29,708.49 |
Table 5. Area of land cover classes in 2023, km2
| Rangeland | Trees | Bare Ground | Snow/Ice | Flooded vegetation | Water | Crops | Built Area | Total | |
| ARAGATSOTN | 2,096.86 | 48.25 | 3.48 | 6.38 | 0.00 | 3.50 | 438.49 | 139.17 | 2,736.12 |
| ARARAT | 1,560.01 | 26.20 | 6.94 | 0.04 | 6.74 | 32.42 | 305.46 | 177.10 | 2,114.91 |
| ARMAVIR | 461.83 | 0.55 | 2.05 | 0.00 | 0.15 | 7.10 | 609.26 | 182.76 | 1,263.70 |
| GEGHARKUNIK | 3,239.85 | 129.56 | 4.28 | 0.94 | 0.65 | 1,274.08 | 404.99 | 193.66 | 5,248.00 |
| KOTAYK | 1,508.64 | 153.10 | 1.08 | 1.60 | 0.00 | 2.57 | 265.38 | 182.43 | 2,114.80 |
| LORI | 2,424.92 | 883.74 | 2.83 | 0.31 | 0.79 | 3.81 | 298.87 | 147.73 | 3,763.00 |
| SHIRAK | 1,784.67 | 13.43 | 0.91 | 2.47 | 0.00 | 31.48 | 742.89 | 142.79 | 2,718.63 |
| SYUNIK | 3,650.25 | 507.74 | 12.65 | 0.09 | 0.02 | 15.86 | 233.22 | 73.53 | 4,493.35 |
| TAVUSH | 1,227.75 | 1,316.33 | 0.05 | 0.04 | 0.02 | 4.35 | 82.03 | 95.67 | 2,726.24 |
| VAYOTZ DZOR | 2,174.55 | 38.13 | 2.51 | 0.35 | 0.00 | 2.35 | 33.28 | 45.37 | 2,296.54 |
| ARMENIA | 20,185.02 | 3,117.51 | 37.33 | 12.21 | 8.39 | 1,378.29 | 3,422.08 | 1,547.66 | 29,708.49 |
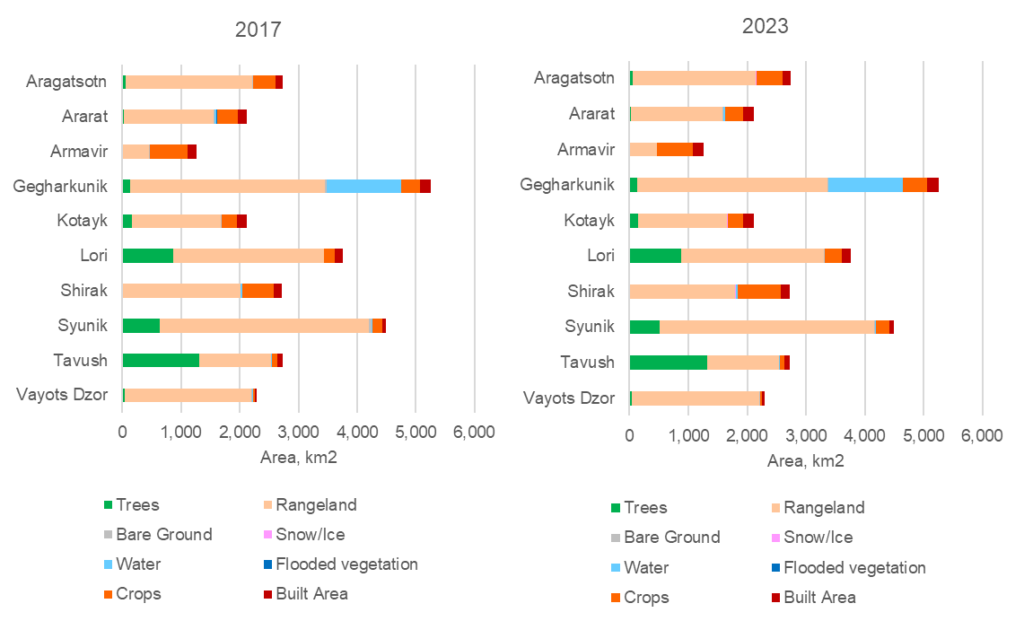
Figure 4. Area of land cover classes across marzes in 2017 and 2023, km2
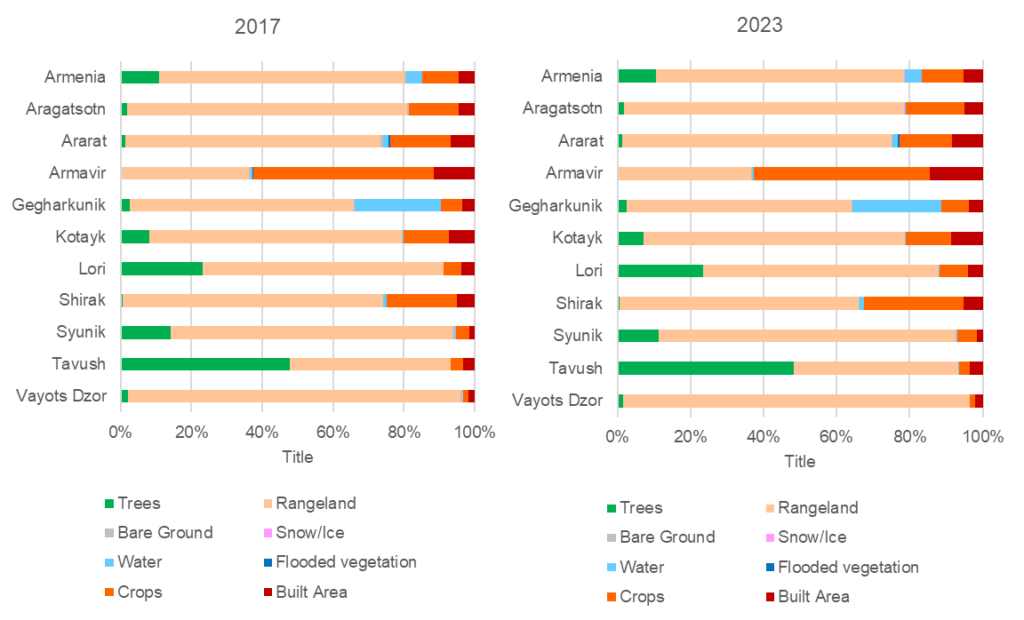
Figure 5. The share of area of land cover classes in Armenia and across marzes in 2017 and 2023, %
Land cover class extent accounting was also carried out for the large watersheds, since one of the key purposes of ecosystem accounting is to assess water-regulating ecosystem services, which are modeled at the watershed level. Since in Armenia watershed boundaries largely coincide with marz boundaries (the Hrazdan, Metsamor, and Arpa watersheds each include two marzes), the pattern of land cover class area distribution and its changes from 2017 to 2023 mirrors the pattern identified at the marz level.
The most human-transformed watersheds are Metsamor (marzes Aragatsotn and Armavir) and Akhuryan (marz Shirak), where croplands and built-up areas together make up around 30% of the territory. The least transformed watersheds are Aghstev (marz Tavush) and Vorotan (marz Syunik). Forests cover large areas in Aghstev watershed (marz Tavush) and Debed watershed (marz Lori).
Table 6. Area of land cover classes, km2
| Rangeland | Trees | Bare Ground | Snow/Ice | Flooded vegetation | Water | Crops | Built Area | ||
| 2017 | Aghstev | 1600.07 | 1401.27 | 1.99 | 0.01 | 0.00 | 3.70 | 69.63 | 98.72 |
| Akhuryan | 1999.78 | 9.30 | 4.42 | 0.00 | 0.07 | 27.25 | 599.85 | 144.59 | |
| Arpa | 3839.27 | 79.92 | 30.63 | 0.15 | 10.84 | 26.36 | 288.32 | 134.83 | |
| Debed | 2719.90 | 843.51 | 4.83 | 0.02 | 0.44 | 3.11 | 212.89 | 141.05 | |
| Hrazdan | 4384.18 | 243.39 | 27.42 | 0.65 | 1.68 | 1281.05 | 765.19 | 545.57 | |
| Metsamor | 2420.53 | 49.32 | 17.31 | 0.02 | 2.41 | 11.80 | 911.62 | 241.75 | |
| Vorotan | 3573.45 | 634.26 | 32.93 | 0.13 | 0.04 | 17.98 | 170.65 | 66.09 | |
| 2023 | Aghstev | 1590.30 | 1397.07 | 0.09 | 0.08 | 0.02 | 4.04 | 80.02 | 103.76 |
| Akhuryan | 1801.94 | 9.54 | 0.90 | 2.36 | 0.00 | 31.54 | 789.01 | 149.95 | |
| Arpa | 3890.99 | 66.30 | 9.26 | 0.73 | 6.22 | 29.55 | 249.59 | 157.67 | |
| Debed | 2575.47 | 865.33 | 2.84 | 0.27 | 0.79 | 4.29 | 325.58 | 151.17 | |
| Hrazdan | 4305.51 | 228.70 | 6.24 | 2.17 | 0.67 | 1280.73 | 794.73 | 630.37 | |
| Metsamor | 2356.44 | 42.74 | 5.25 | 6.48 | 0.66 | 12.27 | 949.72 | 281.20 | |
| Vorotan | 3652.35 | 507.74 | 12.65 | 0.11 | 0.02 | 15.86 | 233.26 | 73.54 |
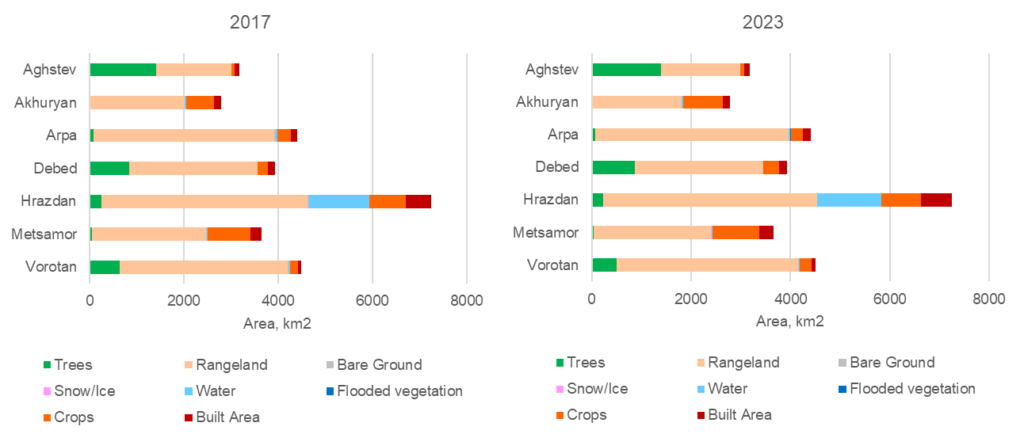
Figure 7. Area of land cover classes across watersheds in 2017 and 2023, km2
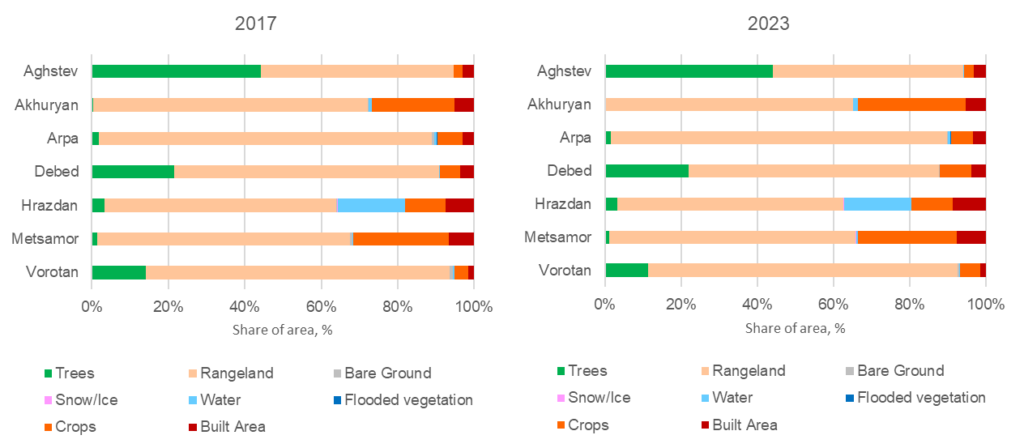
Figure 8. The share of area of land cover classes across watersheds in 2017 and 2023, %
Changes in land cover class extent
Between 2017 and 2023, according to ESRI data, the area of croplands and built-up areas in Armenia increased by 417 km² and 175 km², respectively, while the area of forests and grasslands decreased by 139 km² and 383 km². The total area of natural land-cover types decreased by 578.9 km² (1.95% of the country’s total area) over these years, transitioning to croplands and built-up areas. 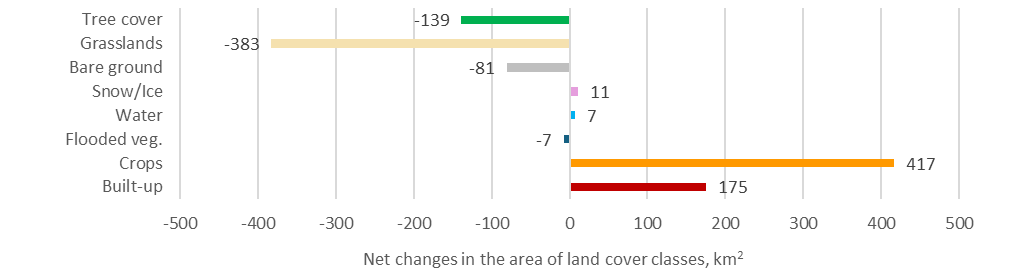
Figure 9. Changes in the area of land cover classes from 2017 to 2023
The map of changes in land cover (Figure 10) shows that built-up areas expanded primarily in the Ararat Valley and around Yerevan (maroon color), while croplands expanded most intensively in the north-western part of the country (orange color in Figure). Local forest expansion occurred in several locations within Armenia’s forest zone in the north-east; however, overall forest extent decreased, mainly due to transitions to grasslands in Syunik. Grasslands expanded in the southern part of Syunik marz, but their total extent across Armenia also decreased due to transitions to croplands.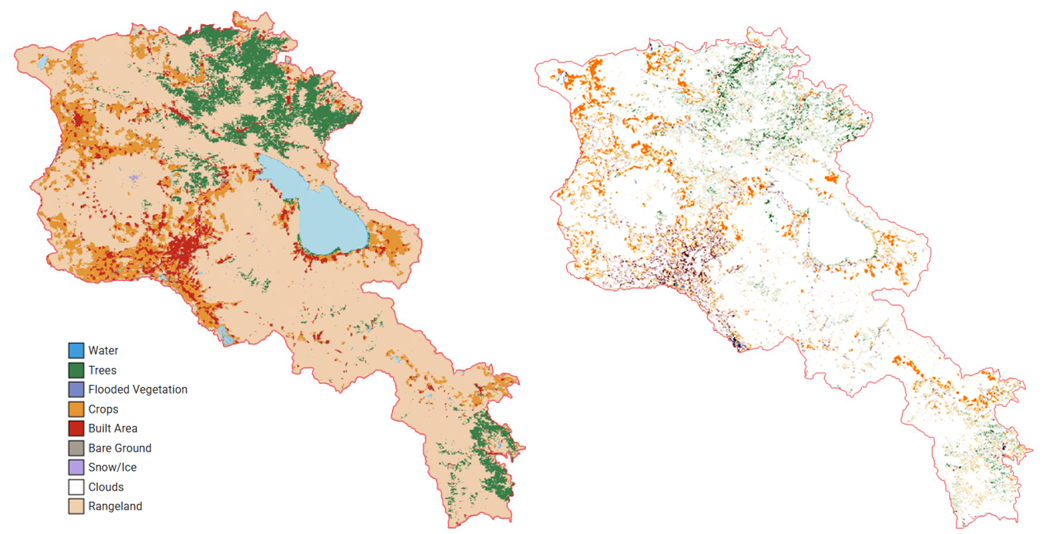
Figure 10. The land cover and its changes: a) ESRI land cover data for 2023; b) The land-cover changes that occurred since 2017, specifically the new land-cover classes that emerged in place of previous ones, are shown.
The land-cover class transition matrix shows how much area of each class transitioned to another class (Table 7). In this matrix, the classes listed in the first column transform into the classes shown across each row. Example: In the tree cover row, the area that remained tree cover is 2909.87 km² (tree cover transitioned to tree cover), tree cover transitioned to grasslands over an area of 362.79 km², to bare ground – 0.02 km², and so on. The most intensive transition was from grasslands to croplands (941 km2), while the reverse transition is less than half of that value (444 km2). A shift from tree cover to grasslands is also noticeable (362 km2). Other transitions are negligible (Fig. 11).
The sum of transitions to other classes corresponds to the loss of tree cover due to these conversions (last column, 369.92 km²). At the same time, other classes transitioned into tree cover, producing its gain of 230.88 km² (bottom row). Thus, the net change in tree cover is a decrease of 139.04 km². These data make it possible to populate rows “Additions to extent” and “Reductions in extent” in the accounting table of land cover class extent (Table 8), which are unknown if we know only the opening and closing extent. As noted in Section 1.4.A, we do not have data to distinguish between managed and unmanaged land cover changes.
Table 7. Land cover class transition matrix from 2017 to 2023, km2
| Tree cover | Grasslands | Bare ground | Snow/ Ice | Water | Flooded veg. | Crops | Built-up | Total area in 2017 | Reduc-tion | |
| Tree cover → | 2909.87 | 362.79 | 0.02 | 0.05 | 0.58 | 0.02 | 3.74 | 2.72 | 3279.79 | 369.92 |
| Grasslands → | 224.03 | 19221.76 | 2.12 | 7.56 | 13.46 | 1.74 | 940.92 | 114.62 | 20526.21 | 1304.45 |
| Bare ground → | 0.05 | 75.63 | 29.67 | 3.70 | 1.97 | 0.24 | 2.10 | 2.59 | 115.94 | 86.27 |
| Snow/Ice → | 0.01 | 0.49 | 0.04 | 0.33 | 0.01 | 0.00 | 0.02 | 0.06 | 0.96 | 0.63 |
| Water → | 0.44 | 8.74 | 2.29 | 0.04 | 101.20 | 0.47 | 7.41 | 1.53 | 122.12 | 20.92 |
| Flooded veg. → | 0.05 | 3.34 | 0.05 | 0.00 | 4.48 | 4.78 | 1.81 | 0.87 | 15.37 | 10.59 |
| Crops → | 3.04 | 444.42 | 0.42 | 0.29 | 6.62 | 1.18 | 2478.53 | 97.21 | 3031.70 | 553.17 |
| Built-up→ | 3.27 | 25.79 | 0.76 | 0.03 | 0.50 | 0.02 | 14.40 | 1335.95 | 1380.72 | 44.77 |
| Total area in 2023 | 3140.75 | 20142.95 | 35.35 | 12.00 | 128.82 | 8.46 | 3448.92 | 1555.56 | 28472.82 | |
| Expansion | 230.88 | 921.19 | 5.69 | 11.67 | 27.62 | 3.68 | 970.39 | 219.61 | 2390.73 |
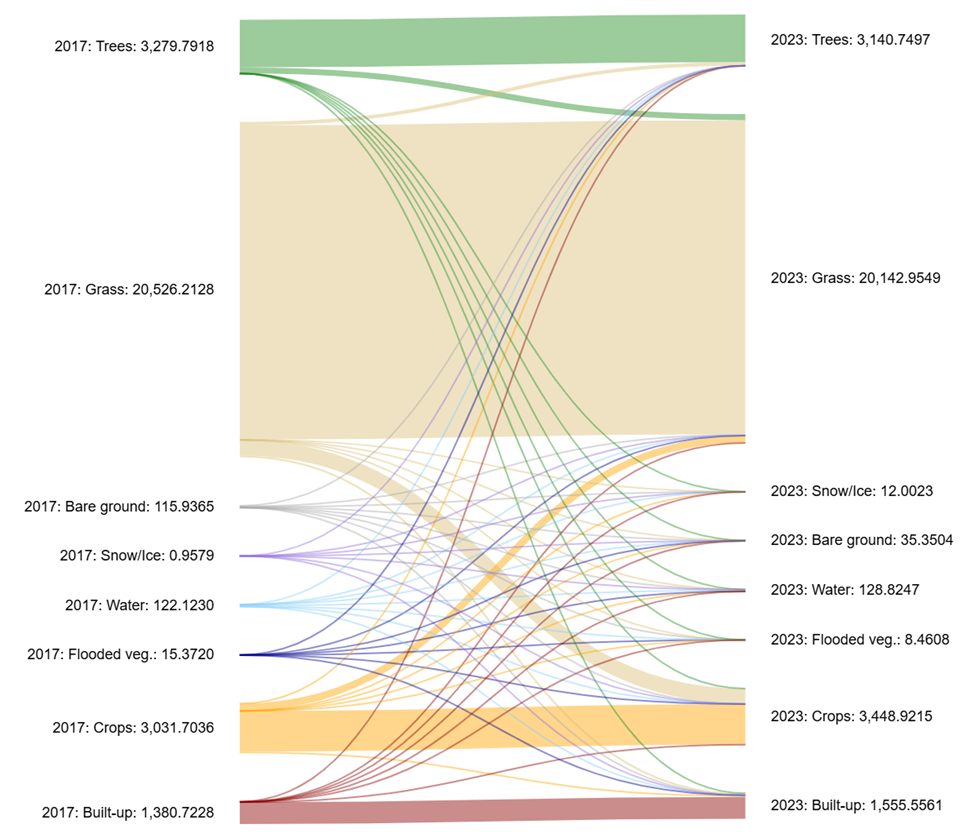
Figure 11. Transitions between land cover classes from 2017 to 2023
Table 8. Accounting table of land-cover class extent for 2017 and 2023, based on ESRI land cover dataset 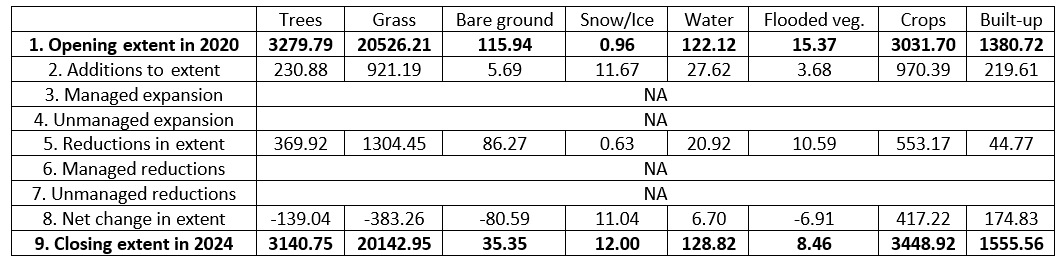
The most significant changes occurred in Shirak marz, where cropland area increased by 200 km² at the expense of grasslands. Similar but less extensive cropland expansion at the expense of grasslands took place in Lori, Gegharkunik, and Aragatsotn. In contrast, in Armavir and Ararat, cropland area decreased. In Armavir, this was due to an increase in built-up areas, while in Ararat, it resulted from both an expansion of built-up areas and grasslands. In Syunik marz, forest area noticeably declined due to an increase in grasslands and croplands. Relative changes in land cover areas present a somewhat different picture. In 2023, the ESRI land cover dataset shows an 80% loss of tree cover in Armavir marz compared to 2017, although this loss is barely noticeable in absolute terms due to the initially small woody area in that marz. The largest relative increase in cropland area was identified in Lori marz — nearly 60%.
Table 9. Changes in area of land cover classes from 2017 to 2023, km2
| Rangeland | Trees | Bare Ground | Snow/Ice | Flooded vegetation | Water | Crops | Built Area | |
| ARAGATSOTN | -64.22 | -4.29 | -9.12 | 6.36 | 0.00 | 0.06 | 58.36 | 12.84 |
| ARARAT | 37.35 | -4.28 | -9.42 | 0.04 | -4.96 | 3.27 | -54.46 | 32.46 |
| ARMAVIR | 6.30 | -2.29 | -3.41 | 0.00 | -1.65 | 0.43 | -35.88 | 36.50 |
| GEGHARKUNIK | -80.52 | -5.37 | -14.81 | 0.90 | -0.75 | -0.02 | 89.89 | 10.68 |
| KOTAYK | 2.07 | -18.64 | -6.39 | 0.86 | -0.01 | 0.08 | -5.26 | 27.28 |
| LORI | -133.47 | 14.22 | -1.72 | 0.28 | 0.35 | 1.17 | 109.66 | 9.50 |
| SHIRAK | -214.12 | 0.34 | -3.40 | 2.47 | -0.06 | 4.26 | 205.33 | 5.18 |
| SYUNIK | 79.18 | -126.52 | -20.49 | -0.04 | -0.02 | -2.12 | 62.58 | 7.44 |
| TAVUSH | -6.54 | 12.23 | -1.28 | 0.04 | 0.02 | 0.35 | -9.49 | 4.68 |
| VAYOTZ DZOR | 16.90 | -8.97 | -11.50 | 0.33 | -0.01 | -0.41 | -1.98 | 5.63 |
| ARMENIA | -364.25 | -143.52 | -82.35 | 11.23 | -7.08 | 7.04 | 403.85 | 175.08 |
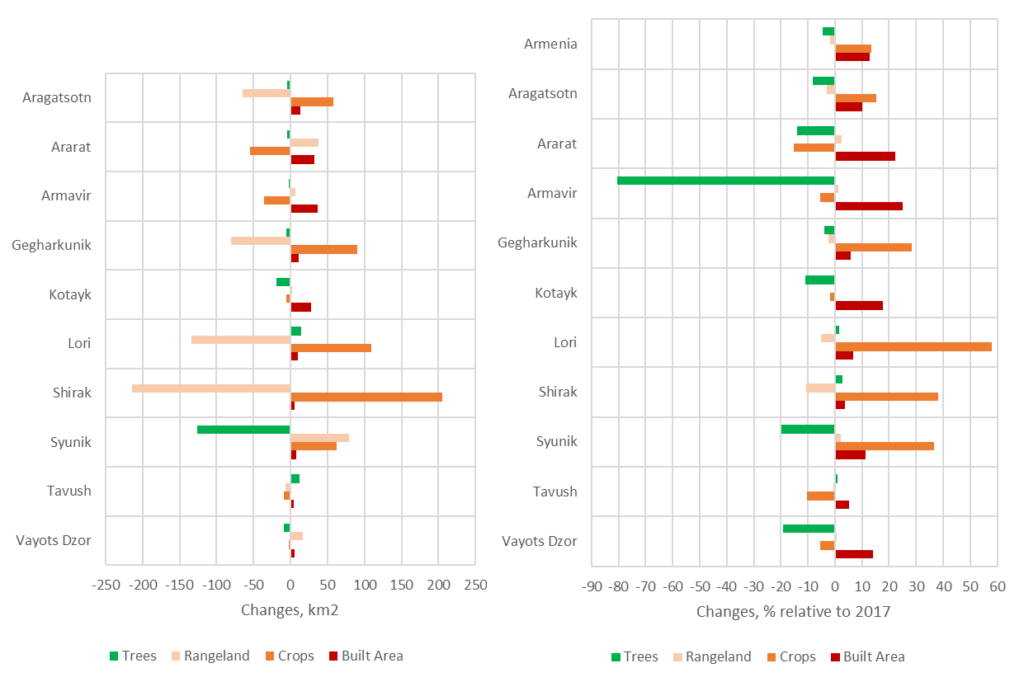
Figure 12. Absolute (km2) and relative (% of 2017 area) changes in area of the main land cover classes in Armenia and across marzes from 2017 to 2023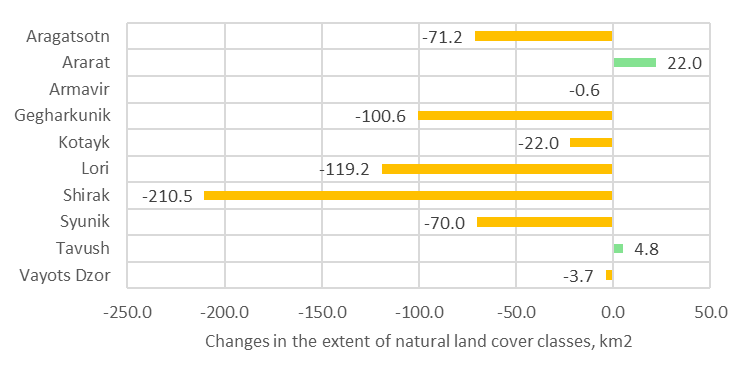
Figure 13. Total changes in the extent of natural land cover classes across marzes from 2017 to 2023
The most significant changes in land cover area occurred in Akhurian watershed (Shirak marz), where cropland area increased by 200 km² at the expense of grasslands. Similar but less extensive cropland expansion at the expense of grasslands took place in Debed watershed (Lori marz). In the Razdan and Metsamor watersheds, grassland areas decreased due to the expansion of croplands and built-up areas. Changes in the Arpa watershed are driven by changes in Ararat marz, where cropland area decreased due to the expansion of built-up areas and grasslands. In Vorotan watershed (Syunik marz), forest area noticeably declined due to an increase in grasslands and croplands.
Relative changes show the largest relative increase in cropland area in Debed watershed (Lori marz) and significant increase in cropland area in Vorotan watershed (Syunik marz) and Akhuryan watershed (Shirak marz). In the Vorotan, Arpa, and Metsamor watersheds, forest area decreased by 10–20%.
Table 10. Changes in area of land cover classes across watersheds from 2017 to 2023, km2
| Rangeland | Trees | Bare Ground | Snow/Ice | Flooded vegetation | Water | Crops | Built Area | |
| Aghstev | -9.77 | -4.20 | -1.90 | 0.08 | 0.02 | 0.34 | 10.39 | 5.04 |
| Akhuryan | -197.84 | 0.25 | -3.52 | 2.36 | -0.06 | 4.29 | 189.17 | 5.35 |
| Arpa | 51.72 | -13.62 | -21.36 | 0.58 | -4.62 | 3.19 | -38.73 | 22.85 |
| Debed | -144.43 | 21.82 | -1.99 | 0.25 | 0.35 | 1.18 | 112.69 | 10.12 |
| Hrazdan | -78.67 | -14.69 | -21.18 | 1.52 | -1.01 | -0.32 | 29.54 | 84.81 |
| Metsamor | -64.09 | -6.59 | -12.06 | 6.46 | -1.75 | 0.47 | 38.10 | 39.46 |
| Vorotan | 78.89 | -126.52 | -20.28 | -0.02 | -0.02 | -2.12 | 62.62 | 7.45 |
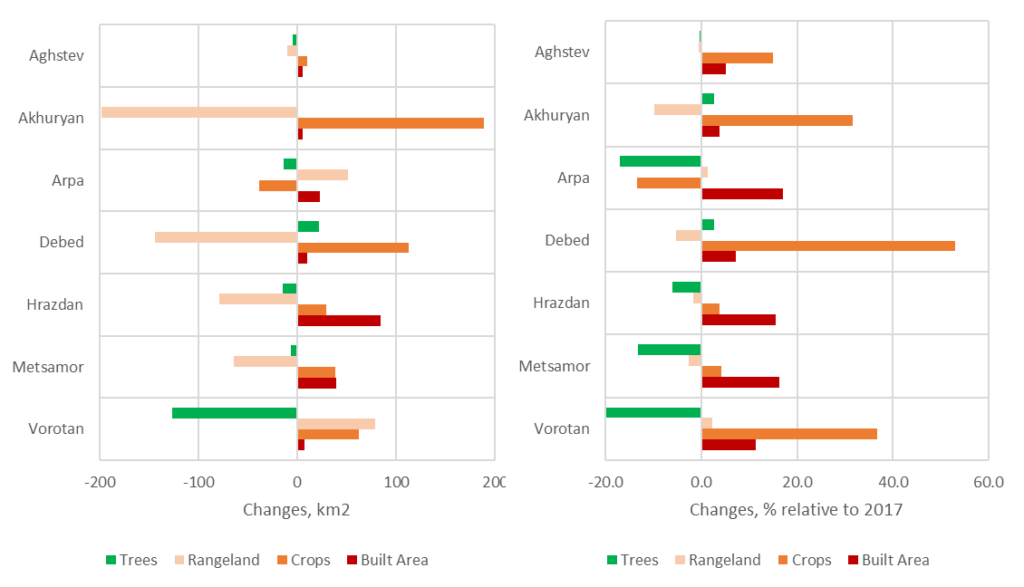
Figure 13. Absolute (km2) and relative (% of 2017 area) changes in area of the main land cover classes across watersheds from 2017 to 2023