We apologize for possible errors in the machine translation of the site
3.1.A.5. Cooling Effect of terrestrial ecosystems
(InVEST Urban Cooling)
GIS modeling and analysis, presentation of results – Eduard Kazakov (NextGIS OÜ, Estonia);
Analysis and presentation of results – Elena Bukvareva (BCC-Armenia)
InVEST model outputs are proxy variables that should be interpreted in relative terms, rather than physical quantities. Nevertheless, the identified values are useful for analyzing the spatial distribution of services across the country’s territory and their balance with indicators of service utilization by the population and the economy.
This section presents preliminary results of testing models for assessing and mapping ecosystem services. In the future, if a decision is made to use these models, they should be calibrated using meteorological measurements made in Armenia.
Since the model is primarily focused on the cooling effect within settlements, one of its features is that it maps the service within a rectangle that encompasses all settlements. As a result, small areas near the boundaries were excluded from the modeling. In our case, this introduces a minor error that can be ignored. However, this flaw should be taken into account in future analyses.
We used in this model the same evapotranspiration coefficients, climatic zones, and scenarios as in the SWY.
InVEST model Urban Cooling Effect is primarily aimed at assessing the cooling effect of green spaces within urban areas. However, it also allows for evaluating this effect over large areas outside of cities. Since the assessment of urban ecosystem services is not a goal of our project, we focused primarily on the entire territory of Armenia and its impact on settlements. Green spaces within settlements was not the focus of the assessment.
The InVEST Urban Cooling model calculates an index of heat mitigation based on cooling capacity of green spaces and distance from them. The model computes the cooling capacity (CC) index for each pixel based on local shade, evapotranspiration, and albedo. СС is used to estimate a temperature reduction by ecosystems.
Heat Mitigation index (HM) estimates the cooling effect of large green spaces (>2 ha) on surrounding urban areas. In our case, it shows the impact of the surrounding area on the settlements. HM is equal to CC if the pixel is unaffected by any large green spaces, but otherwise set to a distance-weighted average of the CC values from the large green spaces and the pixel of interest.
The model calculations are based on indicators of evapotranspiration, albedo, the proportion of area in LULC classes that is covered by tree canopy (shade), air temperature in a rural reference area, and the UHI Effect (Urban Heat Index). The last coefficient shows the difference between the rural reference temperature and the maximum temperature observed in the city. UHI is incorporated into the model as a single value. Calculations based on a single UHI value for all of Armenia are impractical due to the significant variation in conditions across different cities. Thermal images (Landsat 8 Surface temperature data courtesy of the U.S. Geological Survey; Scene ID: LC08_L2SP_170032_20240823_02_T1) show that during the hottest period (August), Yerevan is cooler than the surrounding areas, Gyumri has approximately the same temperature, and Dilijan is warmer (Figures 31A5-1 – 31A5-3). Data from Global Surface UHI Explorer confirm that there is no single UHI coefficient for Armenia. The coefficient varies not only from city to city (Yerevan is cooler, Gyumri is warmer than surrounding area) but also across different parts of the same city (Figures 31A5-4). Therefore, we used UHI=0, meaning we did not account for the influence of this factor.
Figure 31A5-1. Thermal image of Yerevan

Figure 31A5-2. Thermal image of Gyumri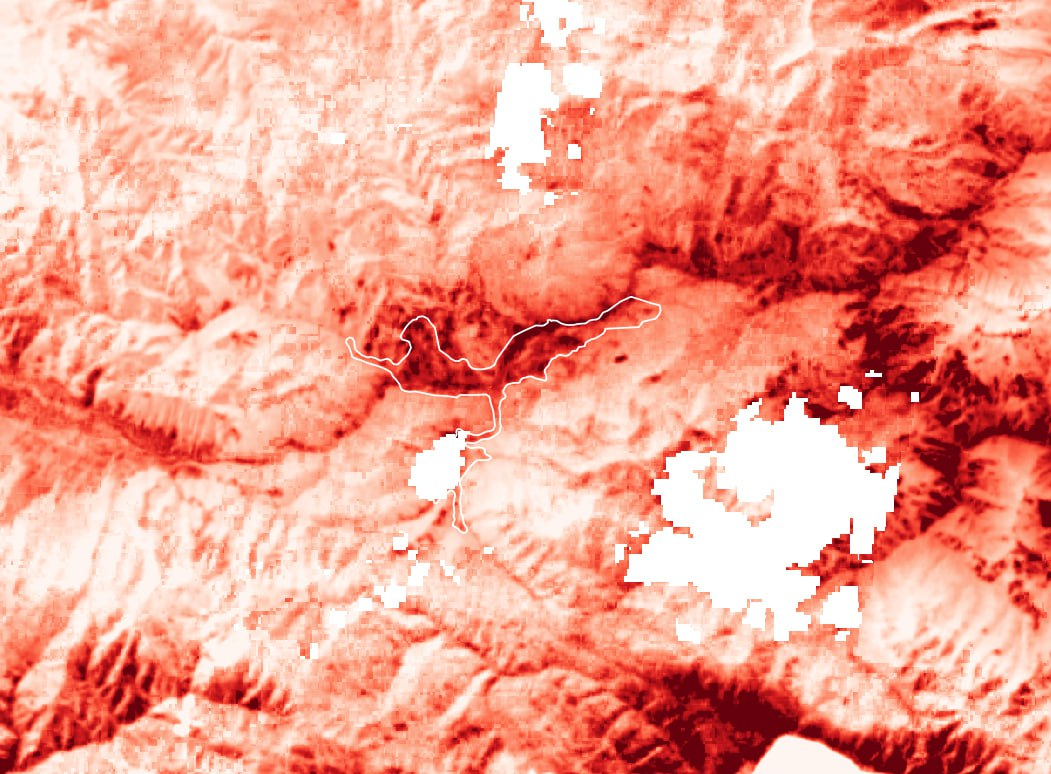
Figure 31A5-3. Thermal image of Dilijan
Data from Global Surface UHI Explorer confirm that there is no single UHI coefficient for Armenia. The coefficient varies not only from city to city (Yerevan is cooler, Gyumri is warmer than surrounding area) but also across different parts of the same city.
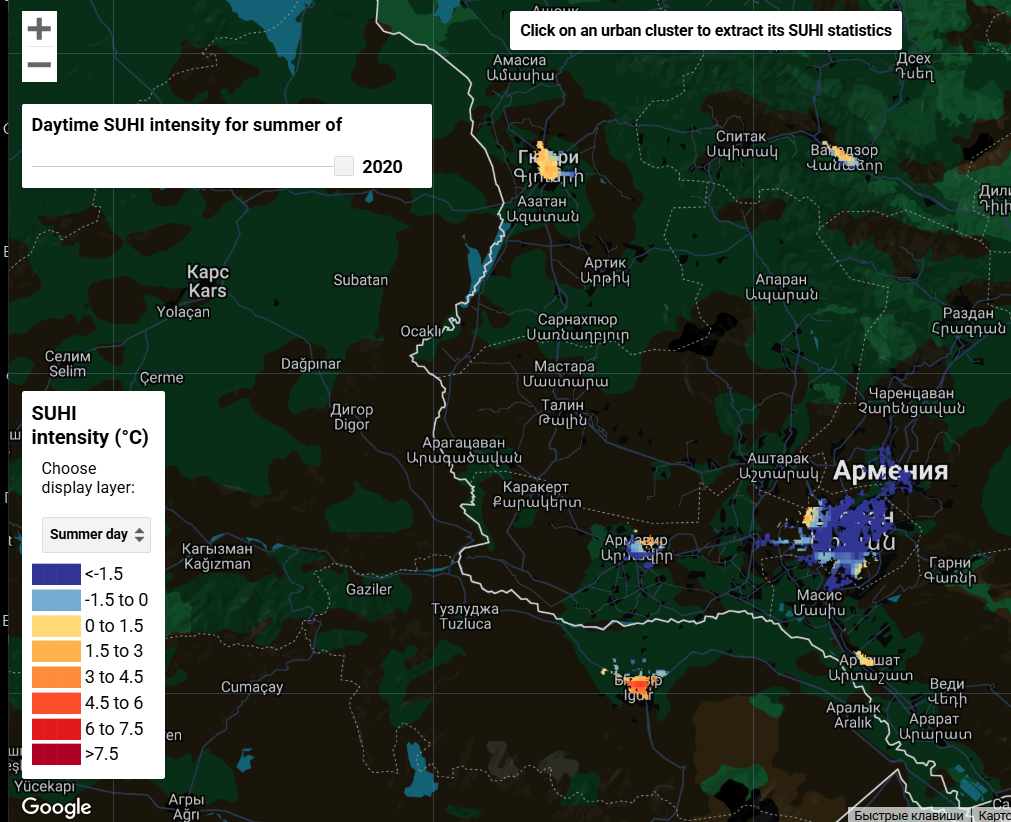
Figure 31A5-4. UHI values in summer (western part of Armenia)
ES provided by terrestrial ecosystems
Estimates of Cooling Capacity (CC) of land cover classes are based on the balance between coefficients of albedo, evapotranspiration cooling, and shadе (i.e., the proportion of area covered by tree canopy). The Kс and albedo coefficients, applied in accordance with InVEST recommendations, yielded the following CC values for land-cover classes (Table 31A5-1; Figure 31A5-5):
– The highest CC is associated with forests due to high evapotranspiration cooling.
– The high CC values for croplands in arid and humid climate zones is explained by the large proportion of orchard areas in those regions (according to ArmStat data). CC of croplands in moderate dry and cool climate zones where orchards are scarce, is much lower, approaching the values for bare ground and grasslands.
– The relatively high CC values for built-up areas are due to our assumption that, on average, 20% of the area in settlements is covered by trees (shadow=0.2). Increasing the area of tree cover in settlements will increase CC of built-up areas; decreasing it will reduce CC.
– CC of grasslands is lower than that of bare ground in three of the four climatic zones, and only slightly higher in the humid zone.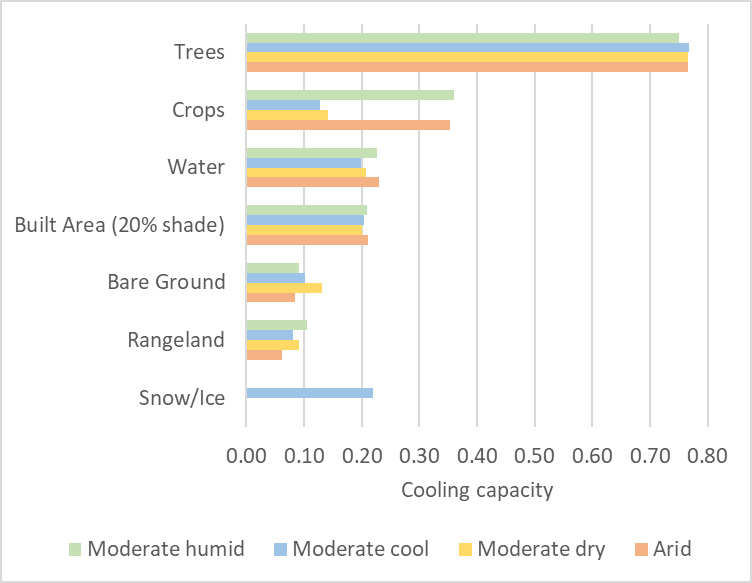
Figure 31A5-5. Cooling capacity of land cover classes in different climate zones
Table 31A5-1. Cooling capacity of land cover classes in different climate zones
| Arid | Moderate dry | Moderate cool | Moderate humid | |
| Snow/Ice | 0.22 | |||
| Rangeland | 0.06 | 0.09 | 0.08 | 0.11 |
| Bare Ground | 0.08 | 0.13 | 0.10 | 0.09 |
| Built Area (20% shade) | 0.21 | 0.20 | 0.20 | 0.21 |
| Water | 0.23 | 0.21 | 0.20 | 0.23 |
| Crops | 0.35 | 0.14 | 0.13 | 0.36 |
| Trees | 0.77 | 0.77 | 0.77 | 0.75 |
In this set of CC values across land-cover classes, the most surprising point is that grasslands have a lower CC than bare ground, that is grasslands are warmer than bare ground. However, in arid zones such a CC relationship is possible because evapotranspiration from grasslands is minimal or absent during the dry season, and the albedo of dry bare soils can exceed that of dried grass. Additionally, due to surface roughness, dry grass cools more slowly than bare ground. There are examples of dry vegetation being warmer than bare soil from the tropical zone (Feldman et al., 2022) and from Central Europe (Hesslerová et al., 2013). Nevertheless, this CC relationship for Armenia requires careful verification. Сhanging any of the coefficients determining СС (evapotranspiration, albedo, and tree canopy cover (shade) can alter the ratio of CC among different land cover classes. This highlights the need for model calibration. The ES provided by natural terrestrial ecosystems was estimated as the difference in indicator values between the 2023 land cover and a bare-ground scenario. In the bare-ground scenario, CC decreases markedly over areas that are currently forested and increases slightly over areas that are currently grassland in moderate cool, dry, and arid zones. Natural vegetation yields substantial cooling in forested areas, slight cooling in grasslands in moderate humid zone and slight warming in grasslands in other zones (Fig. 31A5-6). 
Figure 31A5-6. Maps of cooling capacity. For details see maps in the section “Ecosystem Services/Urban Cooling”
Natural vegetation cools the marzes Tavush, Lori, Syunik, and Kotayk and slightly warms marzes that lack forests. In the marzes Tavush and Lori, where forest area is substantial, forest increases CC by 77% and 57%, respectively (Figure 31A5-7). On average in Armenia, CC for the current land cover is 0.19, while for the bare-ground scenario it is 0.15; thus, ecosystems on average cool the land surface, raising CC by 0.04 (21%). Figure 31A5-7. Cooling capacity of the current land cover and the effect of natural vegetation on cooling capacity
Since we did not assess ES within settlements, our estimate concerns the influence of surrounding ecosystems on CC within settlements, assuming a uniform 20% tree-cover (shade) for all settlements. Heat Mitigation index (HM) estimates the cooling effect of large green spaces (>2 ha) on surrounding urban areas. In our case, it shows the impact of the surrounding area on the settlements. HM is equal to CC if the pixel is unaffected by any large green spaces, but otherwise set to a distance-weighted average of the CC values from the large green spaces and the pixel of interest (Figure 31A5-8). 
Figure 31A5-8. Heat Mitigation index. For details see maps in the section “Ecosystem Services/Urban Cooling”
The cooling/warming effect of the surrounding ecosystems will depend on the CC of ecosystems, as well as by the geometry of the settlement boundaries, i.e., the proportion of the settlement’s area influenced by the surrounding territory. Following the InVEST recommendation, we set the maximum cooling distance—the distance over which green areas larger than 2 ha exert a cooling effect—at 450 m. Across the 1,016 assessed settlements, average CC ranges from 0.06 to 0.50 (i.e., half of the maximum possible value). (Table of CC values for 1,016 settlements in Armenia). The effect of ecosystems on CC within settlements was calculated as the difference between CC values under the current land cover and under a bare-ground scenario. In most settlements (729, or 72% of those assessed), the surrounding ecosystems produce virtually no change in CC relative to bare ground. In 133 settlements (13%), the ecosystems reduce CC, i.e., exert a warming effect; these are evidently settlements surrounded by grasslands in one of three climatic zones—moderately dry, cold, or arid. In 154 settlements (15%), ecosystems increase CC, i.e., exert a cooling effect; these settlements are surrounded by forests or by grasslands in the moderately humid zone. For 20 settlements surrounded by forest, including Dilijan, Jermuk, Tsakhkadzor, the cooling effect is especially noticeable, increasing CC by 0.10–0.35 (Figure. Figure 31A5-9; Table of ecosystem effect on CC values for 1,016 settlements in Armenia).  Figure 31A5-9. The effect of surrounding ecosystems on CC within settlements
2. ES changes from 2017 to 2023
From 2017 to 2023, there were slight changes in CC oppositely directed in different locations and marzes (Figure 31A5-10). Significant decrease in CC occurred in the Syunik due to replacement of some forests with grasslands, as well in the Ararat due to replacement of some croplands with grasslands and built-up areas. Increase in CC occurred in the Shirak and the Lori due to replacement of some grasslands with croplands (Figure 31A5-11; for changes in land cover see here).
Changes in CC in settlements range from a decrease of 61% to an increase of 65% (Table of CC value changes in settlements).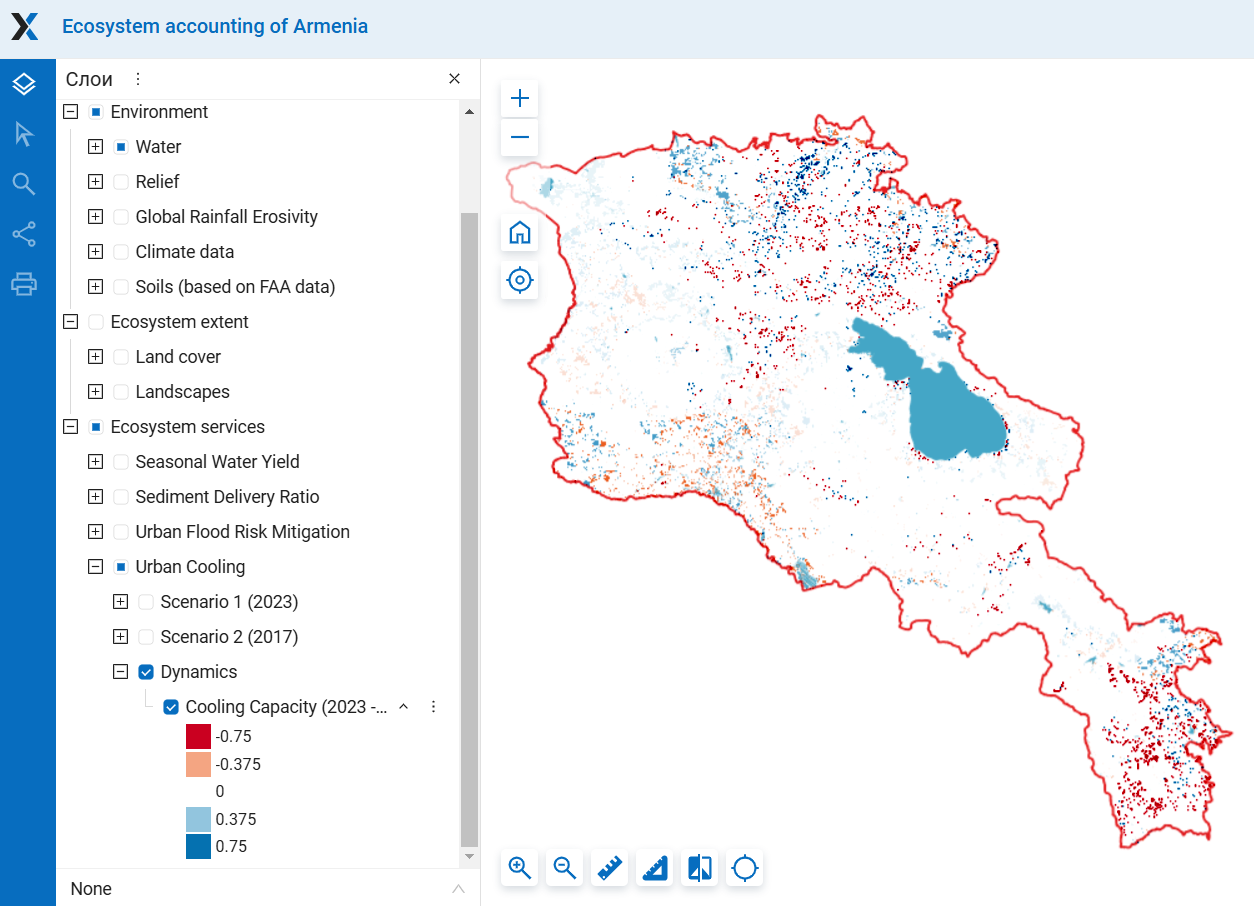
Figure 31A5-10. Changes in CC from 2017 to 2023. For detailed maps see project Web GIS, section “Ecosystem Services/Urban Cooling/Dynamics”
 Figure 31A5-11. Changes in CC from 2017 to 2023 across marzes