We apologize for possible errors in the machine translation of the site
2.5. Estimation of ecosystem extent on the base of landscape-land cover classes (LLCCs)
GIS modeling and analysis – Eduard Kazakov, Maxim Dubinin (NextGIS OÜ, Estonia)
Analysis and presentation of results – Elena Bukvareva (BCC-Armenia)
Searching for Government-reported data – Armen Grigoryan (BCC-Armenia)
The methodology is described in detail in the publication:
Bukvareva E., Grigoryan A., Dubinin M., Kazakov E. Integrating actual land cover data and landscape zone map to assess terrestrial ecosystems in Armenia. Explora: Environment and Resource 4996. https://doi.org/10.36922/eer.4996
PDF
To estimate extent of landscape-land cover classes (LLCCs), the map of landscape zones published in the Fifth National Report of Armenia to the CBD (2014) was used (available in digital form in Forest Atlas of Armenia FAA), along with ESRI land cover data for 2017 and 2023 as well as ESA 2021 data for comparison.
Landscape zones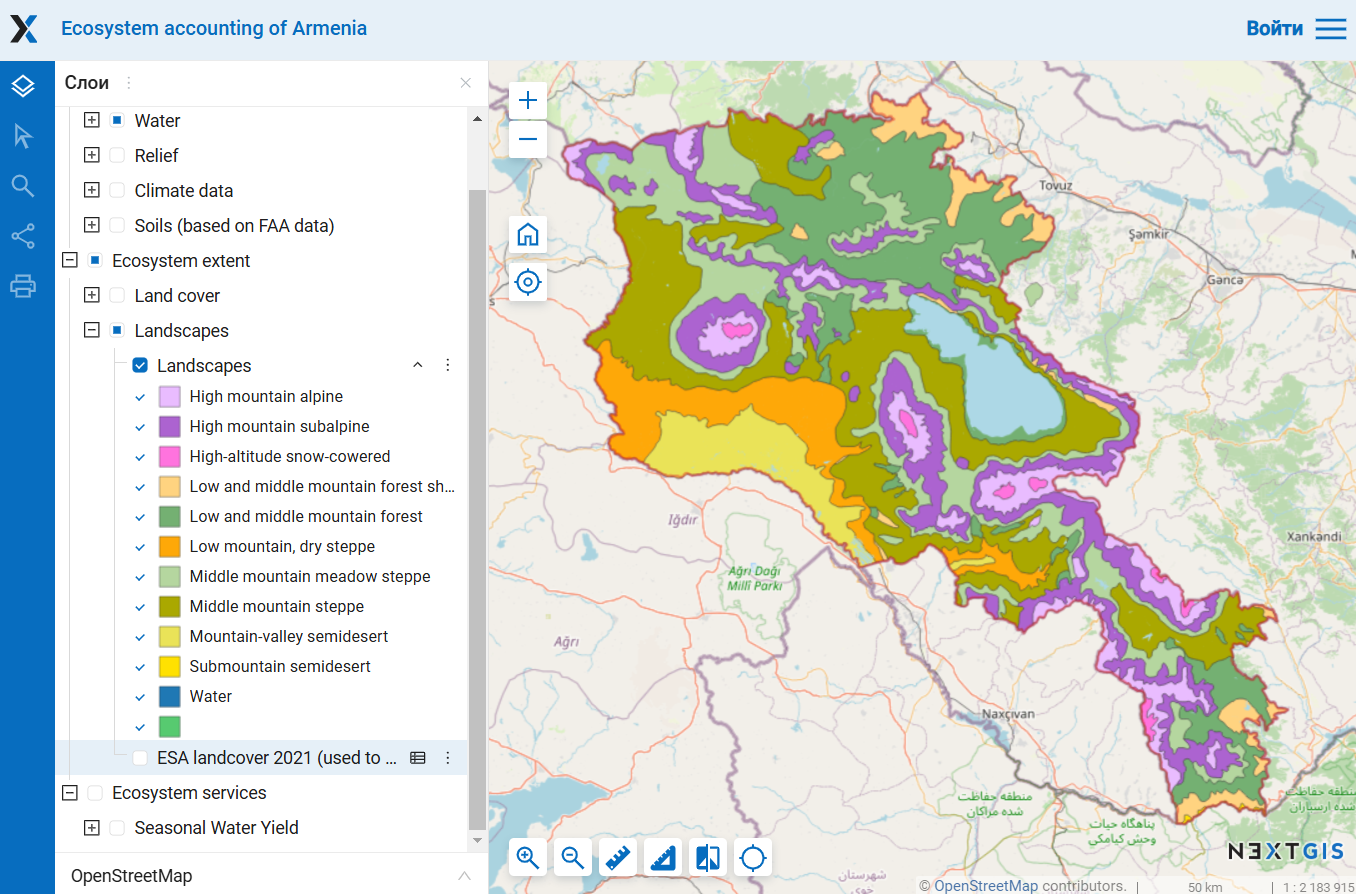
Land cover ESA 2021 Land cover ESRI 2023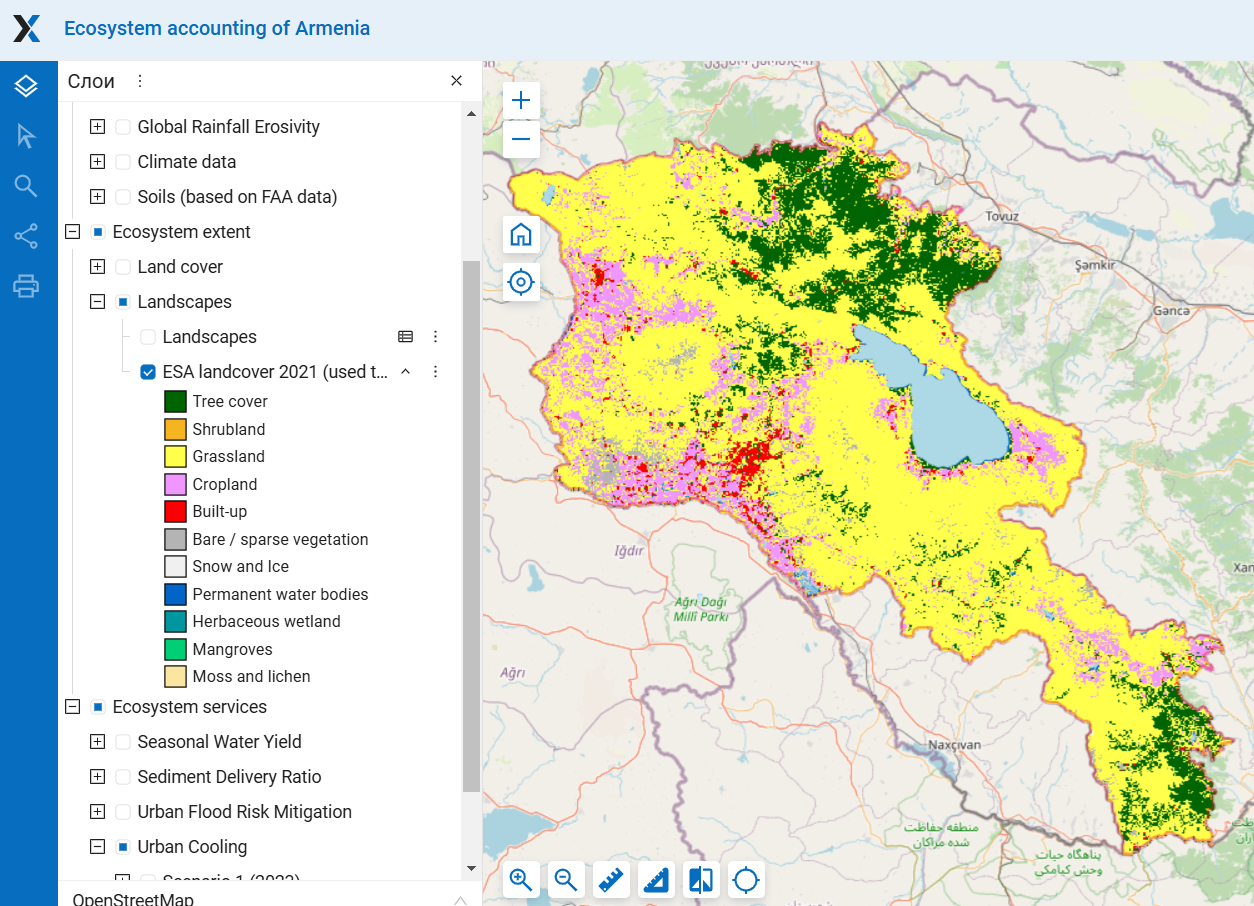
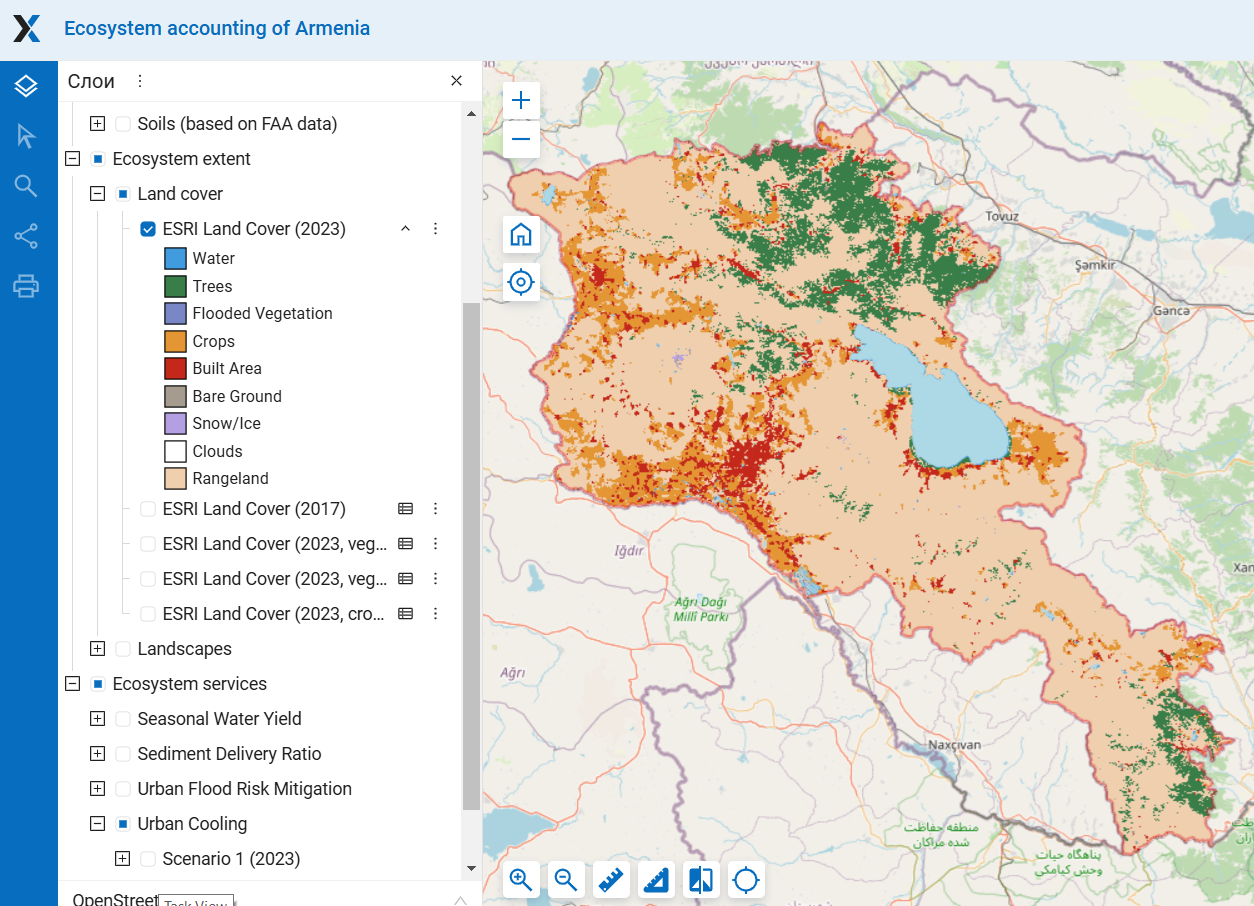 Figure1. The maps used for estimation of the extent of natural landscapes For detailed maps see section “Ecosystem extent”
We intersected ten landscape zones with terrestrial land cover classes. The raster landscape map produced for accounting the extent of natural landscapes (Section 3) was spatially intersected with the land cover raster maps through two steps: (i) the pixel values of the land cover map were multiplied by 100, and (ii) these adjusted values were added to the corresponding pixel values of the landscape map, resulting in a unified raster. For example, a final pixel value of 204 indicates that the pixel has a land cover value of two (e.g., trees) and a landscape value of four (e.g., low and middle mountain forest).
The ESRI land cover dataset includes four terrestrial natural classes (trees, rangelands, bare ground, and snow/ ice), the ESA dataset includes six terrestrial natural classes (tree cover, shrubland, grassland, moss and lichen, bare and sparse vegetation, and snow and ice). The intersection of ten landscape zones with land cover classes resulted in 60 and 40 combinations, respectively. We termed these combinations as LLCCs since they serve as proxies for ecosystems at this stage of analysis without precisely defining the ecosystems they represent. For simplicity of analysis, LLCCs were grouped into 20 combinations, woody (W) and non-woody (N-W) LLCCs in each landscape zone. We found it appropriate to combine all N-W natural classes (shrubland, grassland, moss and lichen, bare and sparse vegetation, and snow and ice) into one category named N-W LLCCs for several reasons: (i) to reduce the number of analyzed LLCCs for a clearer interpretation of the results, (ii) due to relative imprecision in distinguishing between different non-tree land cover classes, (iii) because of the very small area covered by shrubland, moss and lichen, and snow and ice, and (iv) because the IUCN and EUNIS ecosystem and habitat classifications,20,22,26 including the EUNIS version adapted for Armenia,34 group shrub vegetation with heathlands and tundra rather than woody vegetation. Thus, the resulting map includes 20 LLCCs obtained by intersecting woody and non-woody areas with 10 landscape zones.
We used LLCCs as a proxy for ecosystems to assess ecosystem rarity and diversity. We estimated the rarity of LLCCs based on their area – LLCCs with the smallest area were considered rare. To assess the importance of provinces for conserving LLCC diversity in Armenia, we calculated the total share of each LLCC area located within each province. Unlike the rarity ranking, which used the share of an LLCC area relative to its total area in Armenia, this method focused on the proportion of an LLCC area within a province compared to its total area in Armenia. This approach was applied to ensure that the value of rare LLCCs is not diminished.
2.5.A. Extent and rarity of LLCCs in Armenia
In all landscape zones, non-woody LLCC combinations occupy the predominant area. The only exception is the low and middle mountain forest zone, where woody combinations account for 51% of the natural area (Fig. 25A-1).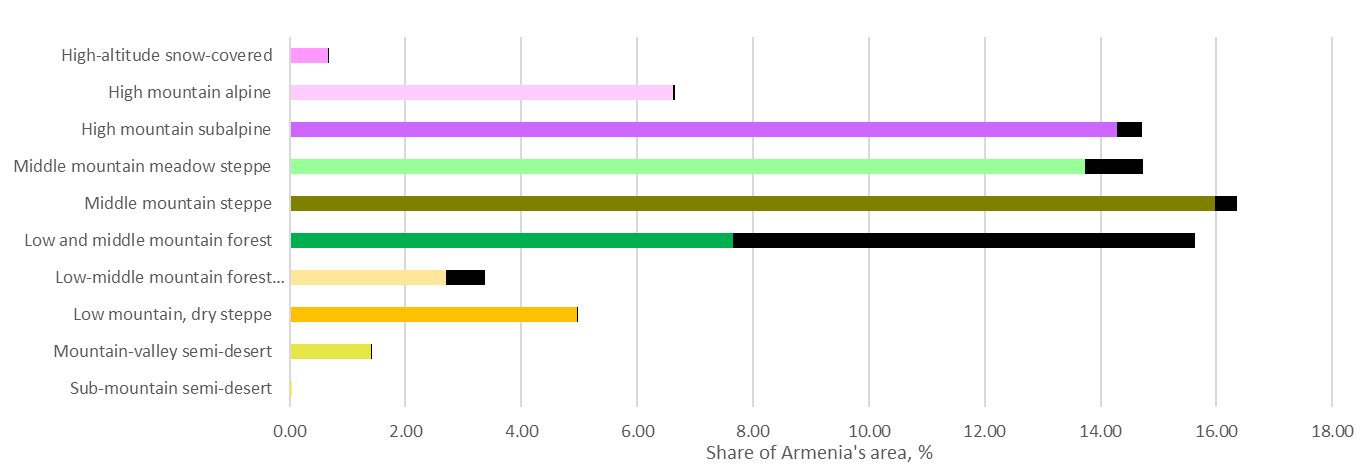 Figure 25A-1. Extent of non-woody LLCC combinations (shown in different colors) and woody combinations (shown in black) across landscape zones in Armenia
The area of the 20 analyzed W LLCCs and N-W LLCCs ranges from 0.005 km2 to 4,700 km2. Half of these LLCCs occupy <1% of the country’s area and can thus be formally classified as rare (Figure 25A-2). This group includes nearly all woody LLCCs, except those in the low and middle mountain forest, forest shelter belt, and middle mountain meadow steppe. Among N-W LLCCs, only two, located in the sub-mountain semi-desert and high-altitude zones, were classified as rare. Three LLCCs, N-W ecosystems in subalpine, middle-mountain, and meadow steppe zones, are widespread, each covering between 14% and 16% of the country’s territory. The remaining LLCCs fall between these extremes. Notably, most of the rare LLCCs do not align with the dominant vegetation types of their respective landscape (e.g., trees in high-altitude zones or semi-deserts). These anomalies require careful verification, as they may result from land cover interpretation errors or may belong to anthropogenic areas. Despite the differences in ESA and ESRI land cover data, the rarity rankings of LLCCs derived from both sources are very similar.
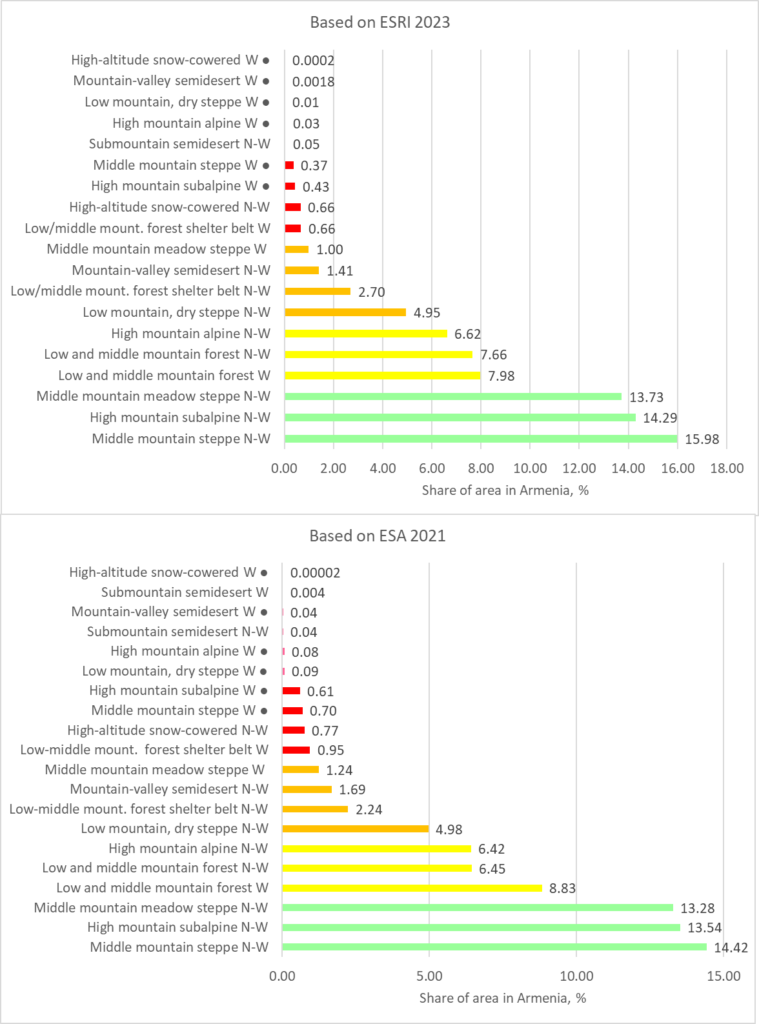
Figure 25A-2. Ranking LLCC types by their area; woody LLCCs are indicated as W, non-woody as N-W; LLCCs occupying no more than 5% of the area of corresponding landscape zone are marked with a ‘●’ symbol.
Maps of LLCC rarity, based on these rankings, show a similar distribution pattern (Figure 25A-3). The rarest LLCCs, covering <1% of the country’s area, are distributed in small areas throughout the country, especially in the south, notably in the province of Syunik. Relatively rare LLCCs, occupying 1 – 5% of the country’s area, are primarily found in the Ararat Valley and its surroundings. These include mountain-valley semi-desert and low-mountain dry steppe LLCCs. Although these LLCCs formally cover a large area, natural vegetation occupies only a small area due to significant anthropogenic transformation. The most widespread LLCCs are located in the central part of the country.
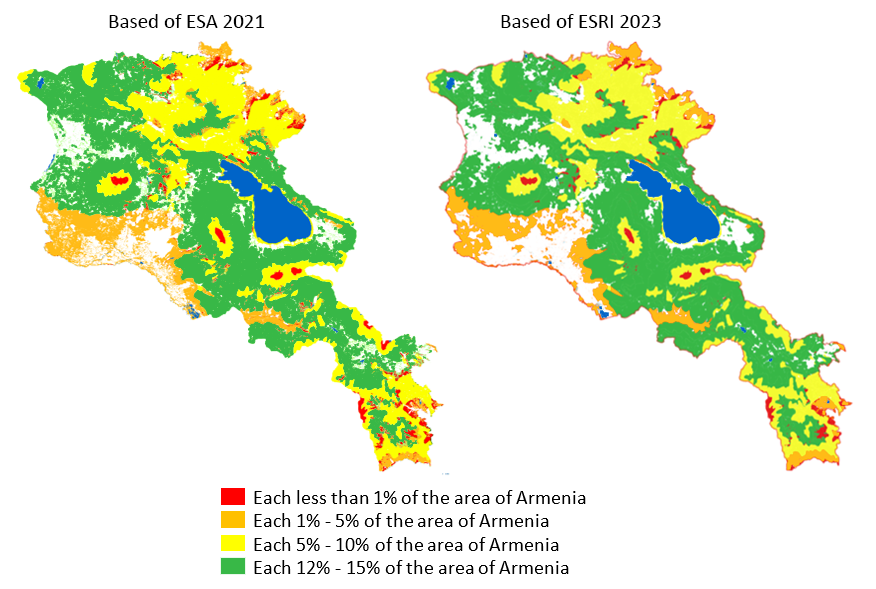
Figure 25A-3. Maps of LLCC rarity based on ESA and ESRI land cover datasets
2.5.B. Marz level: LLCC extent and marz importance for conservation of LLCC diversity in Armenia
This section is primarily aimed at analyzing the role of the marzes in conserving Armenia’s ecosystem diversity. Therefore, instead of using absolute extent values in km², we use the indicator of the share of the area of each LLCC that is preserved within the marzes: Sim=LLCCim/LLCCia*100%, where LLCCimis the area of LLCC i-type in marz m, and LLCCiais the total area of LLCC i-type in Armenia. This indicator was applied to ensure that the value of rare LLCCs is not diminished.
The pattern of distribution of non-woody LLCCs across marzes generally mirrors the distribution of landscape zones. Moreover, these patterns are very similar based on ESRI and ESA data. In contrast, the distribution of woody LLCCs differs significantly both from landscapes zones and between ESRI and ESA datasets. According to ESRI, marzes Gegharkunik, Kotayk, Lori, and Tavush account for a larger share of woody LLCCs than of landscape zones overall. In contrast, Aragatsotn, Ararat, Shirak, Syunik, and Vyots Dzor account for a smaller share of woody LLCCs (Figure 25B-1, a-c). According to ESA, marzes Lori, Syunik, and Tavush account for a larger share of woody LLCCs while Aragatsotn, Armavir, Gegharkunik, and Shirak account for a smaller share of woody LLCCs (Figure 25B-1, d-f).
Marked discrepancies appear when rare LLСCs are concentrated entirely within a single marz—for instance, nearly 100% of woody LLCCs in the high-altitude snow covered zone of Gegharkunik according to ESRI (Fig. 25B-1c), versus nearly 100% of the same LLCC type in Syunik according to ESA (Fig. 25B-1f). These patterns are most likely the result of land-cover misclassifications affecting different marzes in the two datasets. A similar inconsistency is observed in the submountain semi-desert zone, where ESA records 100% of woody LLCC in this zone in Syunik (Fig. 25B-1f), while ESRI reports none. Such differences reflect the different methodologies of image interpretation applied in the ESA and ESRI datasets (see Section 2.1.A). Overall, the most significant inconsistencies are associated with the rarest LLCCs—woody LLCCs in general, and especially their rarest variants in high-altitude and semi-desert zones—some of which may represent artifacts of land-cover classification rather than actual distribution patterns.
The cumulative value of index Sim indicates the overall contribution of a marz to the conservation of LLCC diversity in Armenia. As shown in Figure 25B-1, the contribution of the marzes to the conservation of non-woody LLCCs is similar to their contribution to the conservation of natural landscapes as a whole, whereas their role in conserving woody LLCCs follows a somewhat different pattern.
Statistical tables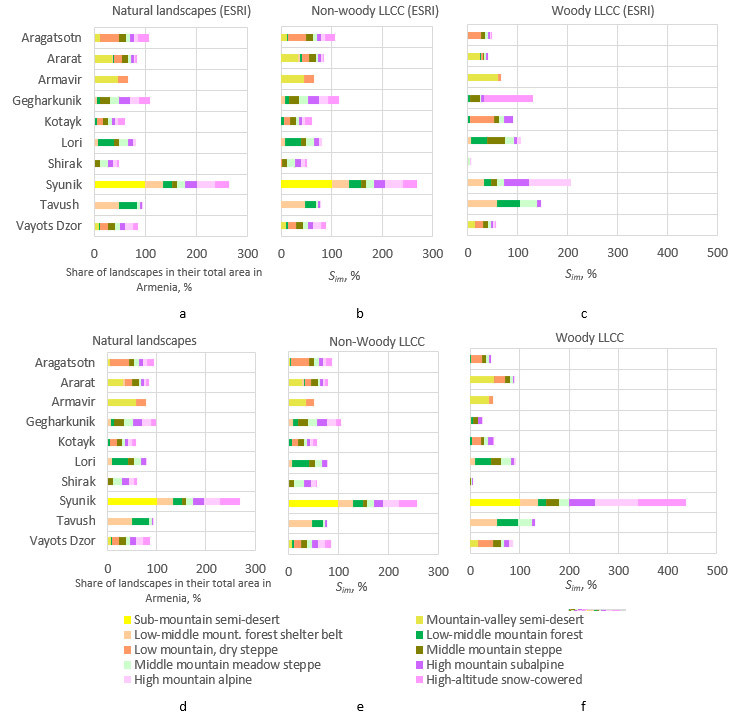
Figure 25B-1. The proportion of the area of natural landscapes and LLCCs across marzes relative to their total area in Armenia, %: a-c) Based on ESRI data; d-f) Based on ESA data. The scales have been made uniform for easier comparison of the data.
Based on the rankings of overall marz contribution to the conservation of all LLCC types (the sum of Si indices for each marz) derived from the ESRI and ESA datasets, only the top-ranked province (Syunik) and the lowest-ranked province (Shirak) remain consistent (Figure 25B-2 a,b). The positions of other marzes vary within the rankings. When accounting all LLCC types, the rankings are largely influenced by the rarest LLCCs, which may be errors in the land cover datasets. For example, Syunik province ranks exceptionally high based on ESA data because almost all pixels of three rare LLCCs (woody areas in high-altitude snowy and alpine zones and sub-mountain semi-desert) are concentrated there. This pattern is not observed in ESRI data. Conversely, Gegharkunik province ranks second in the ESRI-based ranking because almost all woody pixels in the high-altitude snowy zone are concentrated there. If the rarest LLCCs, occupying no more than 5% of the landscape zone’s area (marked with a “●” symbol in Figure 25A-2), are excluded from the calculations, the province rankings based on ESRI and ESA data become more similar (Figure 25B-2 c,d). However, some provinces with similar indicators occupy different positions in the middle of the list.
Statistical tables; Statistical tables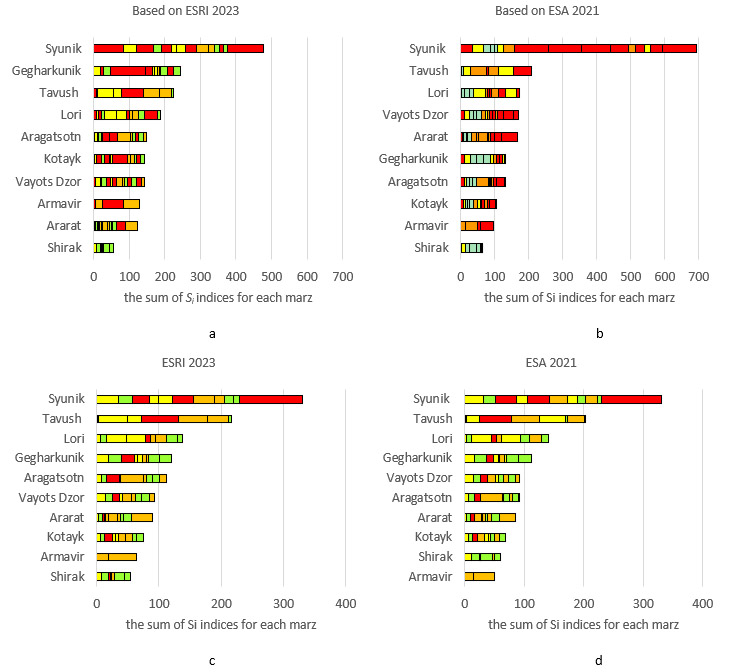 Figure 25B-2. The rankings of marz cumulative importance for conserving LLCC diversity in Armenia (the sum of Si indices for each marz): a,b) all LLCCs; b,c) excluding LLCCs that occupy no more than 5% of the landscape zone’s area. The LLCCs are shown in red, the less rare ones in orange, the relatively common in yellow, and the most common in green, as in the figure 25A-2. The total percentage for provinces can exceed 100%.
The contribution of marzes Tavush, Syunik, and Lori to the conservation of LLCC diversity differs of their importance for landscape diversity (Section 2.4). Moreover, these differences are revealed in both the ESRI and ESA data, indicating that they are not the result of land-cover misclassifications (Figure 25B-3). These three marzes stand out from the others because they preserve most of the woody LLCCs (Figure 25B-4), which are generally rarer in Armenia than the non-woody ones.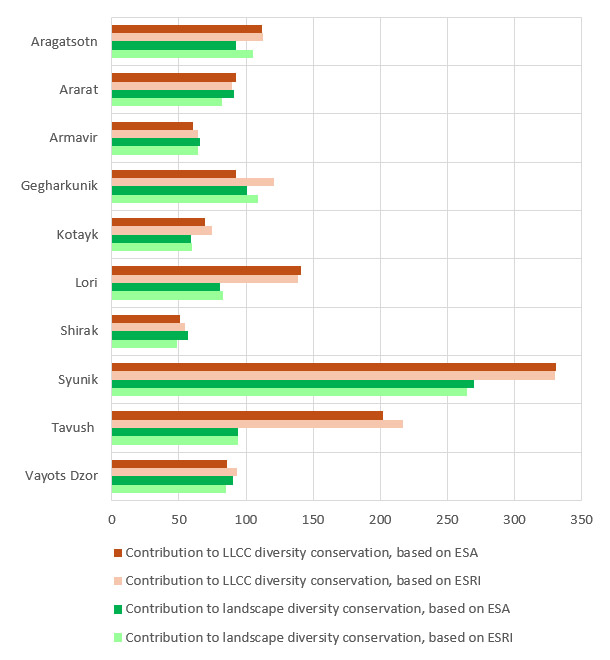
Figure 25B-3. Marz contribution to conservation of LLCC and landscape diversity in Armenia, based on ESRI and ESA data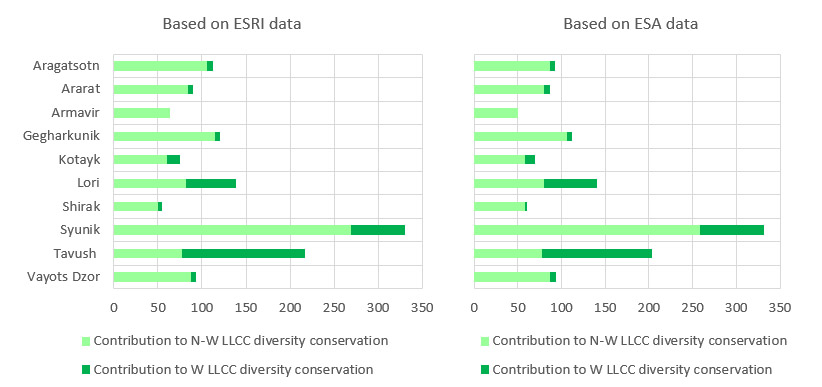 Figure 25B-4. Marz contribution to conservation of non woody and woody LLCC diversity in Armenia, based on ESRI and ESA data
2.5.С. Changes in LLCC extent and marz importance for conservation of LLCC diversity in Armenia
Land cover changes recorded by ESRI data from 2017 to 2023 have resulted in changes in the area of natural landscapes and LLCC extent (Figure 25C-1). The data on LLCC changes provides the following additional information compared to the data on landscape changes (Section 2.4.B):
– The area of woody LLCCs has decreased more significantly than that of N-W LLCCs within the middle-mountain meadow steppe;
– The total reduction in the area of mountain forest landscapes is driven by opposing changes in woody and N-W LLCCs, specifically, a decrease in woody LLCCs and an increase in N-W LLCCs;
– The total area of the forest shelter belt has remained unchanged, although the woody LLCCs within it have decreased.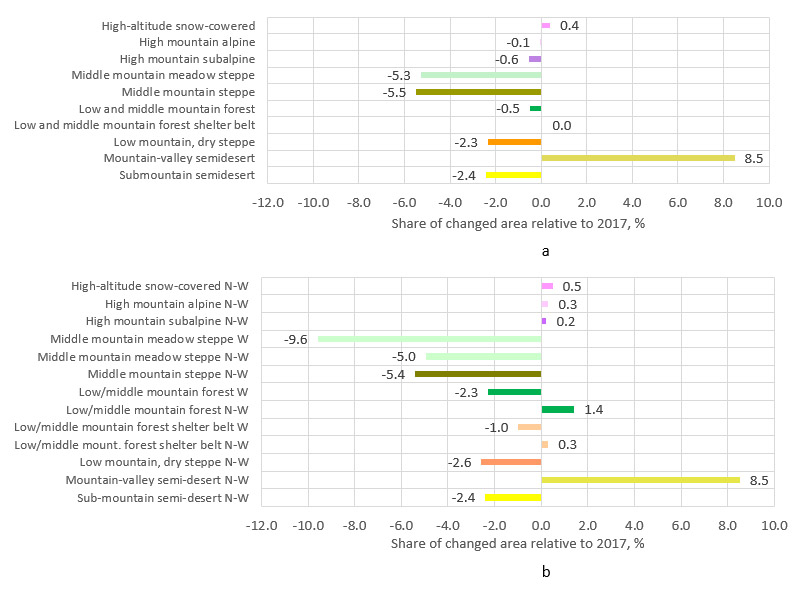
Figure 25C-1. Changes in the extent of natural landscapes (a) and LLCC (b) from 2017 to 2023 based on ESRI data
For the assessment of changes in provincial importance (Figure 25C-2), the data on LLCCs provides the following additional information: (i) the importance of the Syunik province for conserving LLCCs has decreased, even though it has remained unchanged with respect to landscapes and (ii) the importance of the Tavush province for conserving LLCCs has grown significantly more than it has for landscapes.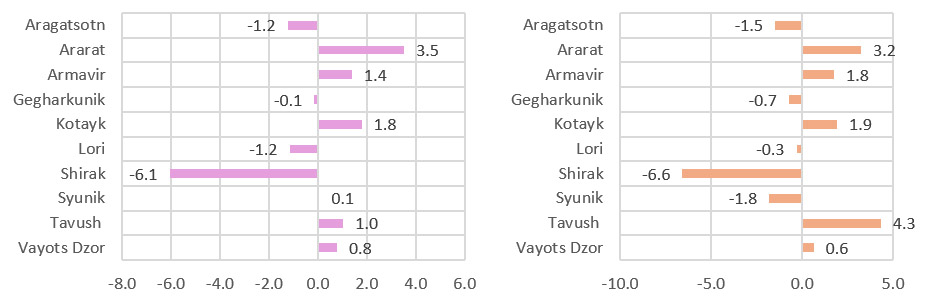 Figure 25C-2. Changes in marz importance for conservation of diversity of natural landscapes (a) and LLCC (b) in Armenia from 2017 to 2023 based on ESRI data
Preliminary conclusions for organizing ecosystem accounting from the LLCC exercise are as follows:
– The LLCC map makes it possible to identify rare LLCCs, however, rare LLCCs with a very small area must be carefully validated to exclude land cover classification errors;
– The rarer the LLCCs are, the greater the differences in estimates between the land-cover datasets. The same can be expected when accounting for real rare ecosystems with small areas;
– LLCC mapping provides additional information compared to the data on landscape extent.