We apologize for possible errors in the machine translation of the site
ES of seasonal water flow regulation
(InVEST Seasonal Water Yield model)
GIS modeling and analysis, presentation of results – Eduard Kazakov (NextGIS OÜ, Estonia);
Analysis and presentation of results – Elena Bukvareva (BCC-Armenia);
Assessment of the alignment of results with real watersheds in Armenia – Vardan Asatryan (NAS RA)
Assessment of the relevance of modeling results for Armenia – external expert Alexander Arakelyan (NAS RA)
The ES of seasonal flow redistribution and baseflow provision is extremely important for Armenia, which has a seasonal climate with dry summers over a significant part of the territory. The ES was estimated and mapped using InVEST Seasonal Water Yield model. The model takes into account the monthly amount of precipitation, soil permeability, and the water balance of each pixel, including moisture that comes into it from the overlying pixels. The main resulting indicators for assessing the ecosystem service are quick flow (QF), that is, the generation of streamflow with watershed residence times of hours to days; and baseflow (B), that is the generation of streamflow with watershed residence times of months to years. Values of cumulative baseflow (Bsum) show the flow through a pixel, contributed by all upslope pixels (Figure 31A2-1). Baseflow ensures runoff maintaining during the dry season and possible droughts.
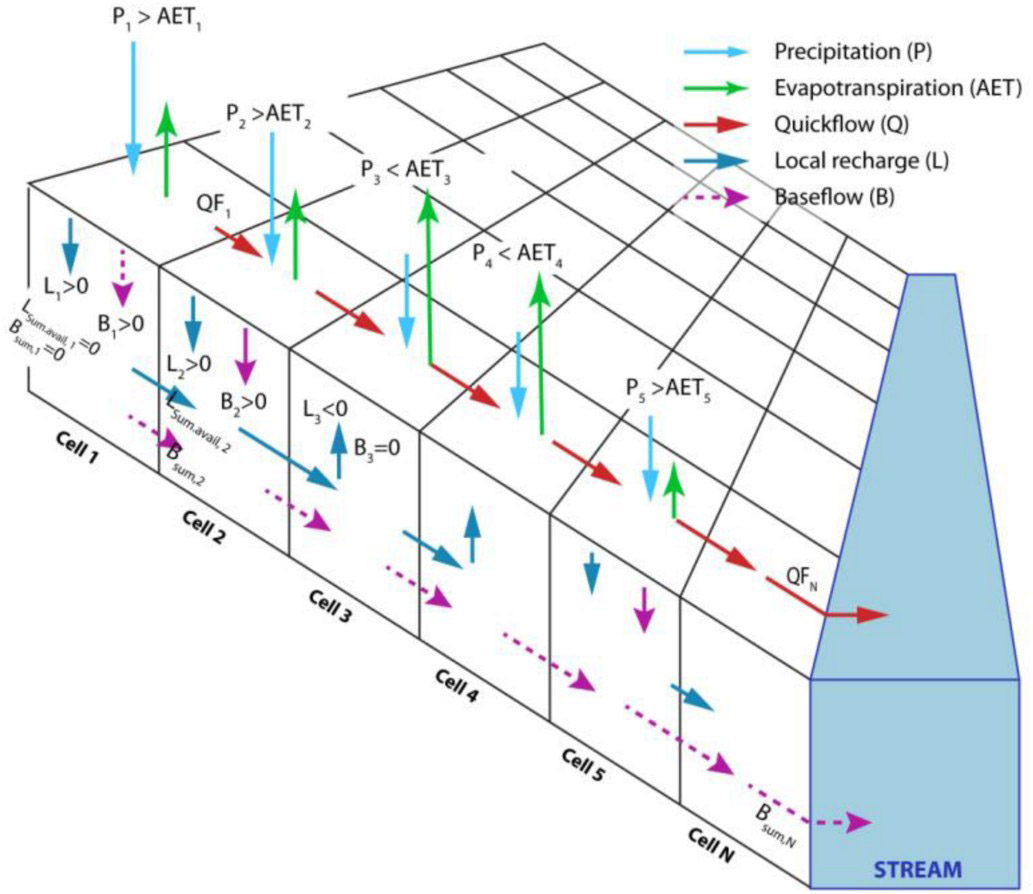
Figure 31A2-1. The InVEST Seasonal Water Yield model diagram (from Hamel et al., 2020)
The coefficients used for the modeling can be found here
InVEST model outputs are proxy variables that should be interpreted in relative terms, rather than physical quantities. Nevertheless, the identified values are useful for analyzing the spatial distribution of services across the country’s territory and their balance with indicators of service utilization by the population and the economy.
This section presents preliminary results of testing models for assessing and mapping ecosystem services. In the future, if a decision is made to use these models, they should be calibrated using hydrological measurements made in Armenia.
The methodology and results will be described in detail in a forthcoming publication.
ES provided by terrestrial ecosystems
The baseflow values (B) for the actual land cover (ESRI 2023) are much higher, while the quick flow (QF) values, on the contrary, are lower compared to hypothetical cases where all natural ecosystems are replaced with bare ground or croplands (Table 31A2-1). The difference between runoff values for the actual land cover and bare ground can be interpreted as the ES provided by terrestrial vegetation: B = 47.8 mm in average, and QF = -22.2 mm in average. Thus, ecosystems provide 93% of baseflow and reduce quickflow by 22%.
ES maps show that under the bare ground and cropland scenarios, baseflow is almost absent (Figure 31A2-2), meaning that the existing baseflow is almost entirely provided by terrestrial ecosystems..
Table 31A2-1. Mean ES indicator values for Armenia under different scenarios
| Scenario | Baseflow, mm (B) | Quick flow, mm (QF) | (B+QF) | Share of B in total flow, % |
| Land cover 2017 | 51.97 | 97.01 | 148.97 | 34.88 |
| Land cover 2023 | 51.28 | 98.04 | 149.32 | 34.34 |
| Bare ground scenario | 3.43 | 120.22 | 123.65 | 2.78 |
| Cropland scenario | 3.58 | 124.96 | 128.54 | 2.78 |

Figure 31A2-2. Maps of ES indicators for different scenarios. For detailed maps see section “Seasonal Water Yield” in the project WebGIS
With the current landcover, the baseflow is on average 35% of the total flow (from 28 to 40% in different watersheds). With the bare ground scenario, the baseflow is only 3% (from 2 to 4%) (Table 31A2-2; Figure 31A2-3). The values of these indicators across the marzes largely mirrors them for the corresponding watersheds (Figure 31A2-4).
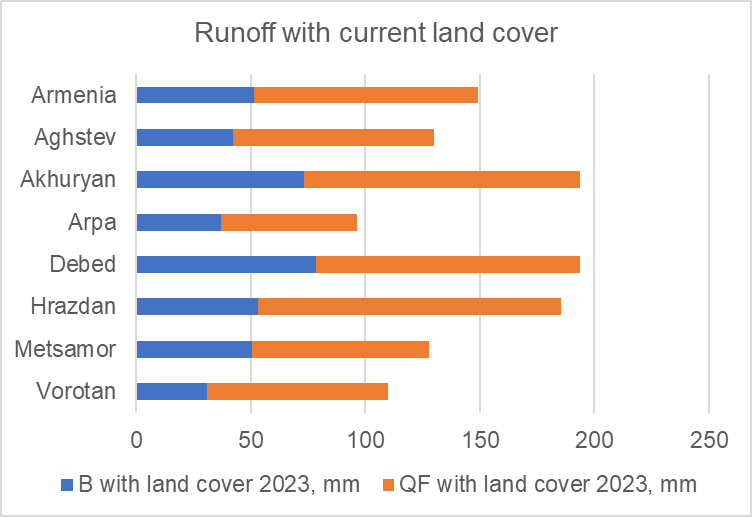

Figure 31A2-3. Baseflow and quick flow under the current land cover and the bare ground scenario across watersheds
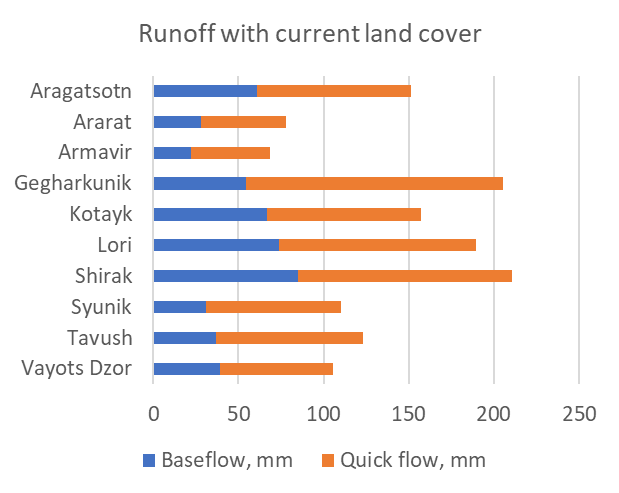
Figure 31A2-4. Baseflow and quick flow under the current land cover across marzes
We estimated ES volume provided by terrestrial vegetation as difference between ES indicator values for the current land cover in 2023 and the bare ground scenario where all grasslands and trees were replaced by bare ground. Across watersheds, ecosystems provide 92%–95% of baseflow (Table 31A2-2; Figure 31A2-5) and reduce quick runoff by 13%–36% (Table 31A2-2; Figure 31A2-6).
Figure 31A2-5. Ecosystem effects on baseflow: (a) baseflow under current land cover and the component provided by ecosystems; (b) share of baseflow provided by ecosystems (%).
Figure 31A2-6. Ecosystem effects on quick flow: (a) quick flow under current land cover and its part reduced by ecosystems; (b) share of quick flow reduced by ecosystems (%).
Table 31A2-2. ES indicators under the current land cover and the bare ground scenario across watersheds
| Indicators | Voro- tan | Metsamor | Hrazdan | Debed | Arpa | Akhuryan | Aghstev | Armenia | ||
| Land cover ESRI 2023 | Baseflow, mm | B2023 | 31.0 | 50.4 | 53.4 | 78.3 | 37.3 | 73.2 | 42.4 | 51.3 |
| Quick flow, mm | QF2023 | 79.2 | 77.5 | 132.0 | 115.6 | 59.3 | 120.7 | 87.6 | 98.0 | |
| Share of B in total flow, % | 28.2 | 39.4 | 28.8 | 40.4 | 38.6 | 37.7 | 32.6 | 34.3 | ||
| Bare ground scenario | Baseflow, mm | Bbg | 2.3 | 2.8 | 3.1 | 6.5 | 1.9 | 4.9 | 3.6 | 3.4 |
| Quick flow, mm | QFbg, | 104.6 | 90.7 | 149.9 | 148.2 | 80.6 | 138.1 | 117.3 | 120.2 | |
| Share of B in total flow, % | 2.1 | 3.0 | 2.0 | 4.2 | 2.3 | 3.5 | 3.0 | 2.8 | ||
| Ecosystem effects | Baseflow provided by ecosystems, mm | Beco= B2023-Bbg | 28.7 | 47.6 | 50.3 | 71.8 | 35.4 | 68.2 | 38.8 | 47.8 |
| Share of baseflow provided by ecosystems, % | Beco*100/B2023 | 92.6 | 94.4 | 94.2 | 91.7 | 94.9 | 93.2 | 91.5 | 93.2 | |
| Reduction of quickflow by ecosystems, mm | QFeco = QF2023-QFbg, | -25.5 | -13.2 | -17.8 | -32.6 | -21.3 | -17.4 | -29.7 | -22.2 | |
| Share of quick flow reduced by ecosystems, % | QFeco* 100/ QF2023, | -32.2 | -17.0 | -13.5 | -28.2 | -35.9 | -14.4 | -33.9 | -22.7 |
Table 3. Cumulative baseflow (Bsum) in the lower river reaches for actual land cover 2023 and for scenario when all natural ecosystems are replaced by bare ground
| Land cover, 2023 | Bare ground scenario | Difference Bsum2023-Bsum bare | Share of Bsum provided by terrestrial ecosystems, % | |
| Aghstev | 686063872 | 53702228 | 632361644 | 92.2 |
| Akhuryan | 1562785152 | 82415360 | 1480369792 | 94.7 |
| Argichi | 75929520 | 3704933 | 72224587 | 95.1 |
| Arpa | 313119360 | 11837469 | 301281891 | 96.2 |
| Azat | 349204672 | 11007498 | 338197174 | 96.8 |
| Debed | 2672169472 | 179894192 | 2492275280 | 93.3 |
| Gavaraget | 422896480 | 13807621 | 409088859 | 96.7 |
| Hrazdan | 3543649536 | 154972240 | 3388677296 | 95.6 |
| Masrik | 43279976 | 1879218.75 | 41400757.25 | 95.7 |
| Metsamor | 1676233984 | 72298784 | 1603935200 | 95.7 |
| Vedi | 134872176 | 6922562 | 127949614 | 94.9 |
| Voghji | 75920344 | 4065560.75 | 71854783.25 | 94.6 |
| Vorotan | 300472096 | 15817257 | 284654839 | 94.7 |
Table. Average baseflow and quick flow in provinces with land cover 2023
| Baseflow, mm | Quick flow, mm | |
| Aragatsotn | 61 | 91 |
| Ararat | 28 | 50 |
| Armavir | 22 | 47 |
| Gegharkunik | 55 | 151 |
| Kotayk | 67 | 90 |
| Lori | 74 | 116 |
| Shirak | 85 | 126 |
| Syunik | 31 | 79 |
| Tavush | 37 | 86 |
| Vayots Dzor | 39 | 66 |
.
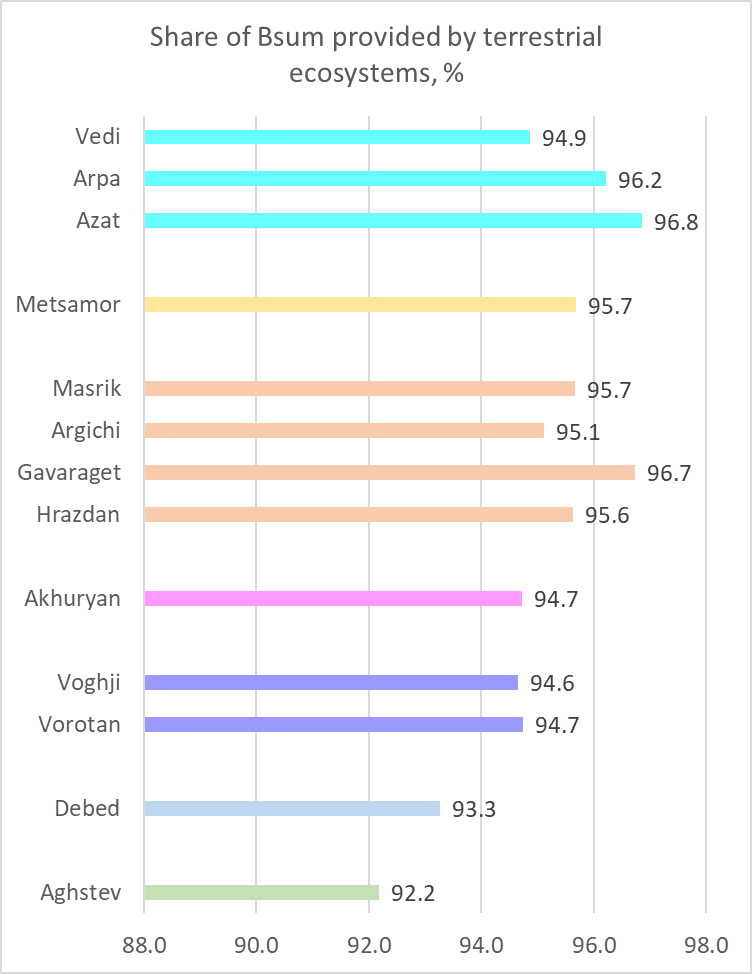
Figure. The share of baseflow (%) provided by terrestrial ecosystems in watersheds and in the lower river reaches
Analysis of ES indicators across vegetation zones shows that the highest average baseflow values occur in alpine and subalpine zones, while woody vegetation exhibits levels similar to those of various grassland types. The range of values within individual polygons of certain vegetation zones is quite large — in alpine, subalpine, meadow-steppe, forest zones, and juniper woodlands (Figure 31A2-7a). Proportion of current baseflow contributed by ecosystems is lowest in forest, steppe, and marsh zones (88–89%), and highest (98%) in the desert zone due to the specific characteristics of the only small area where it is currently found in Armenia. In other vegetation zones, this indicator ranges from 93% to 96% (Figure 31A2-7b). 
Figure 31A2-7. Baseflow indicators across vegetation zones. Red dots indicate average values, while colored bars represent the range of values within individual polygon
The highest baseflow values (155 and 137 mm) are calculated for alpine and subalpine grasslands, while the forest zone showed a minimal baseflow of 29 mm, similar to that of the steppes (25 mm); both are lower than those in the semidesert and desert zones. The proportion of baseflow contributed by ecosystems is also minimal in the forest and steppe zones (89%). This counterintuitive result, in our view, is explained by the combined effects of multiple factors that determine baseflow—precipitation, terrain slope, and soil permeability. Very high absolute baseflow values in mountain grasslands result from the high precipitation in the mountains. The low baseflow values in the forest zone are most likely the result of forests occurring predominantly on the steep slopes of gorges and mountains. According to our assessment, the highest mean slope among the vegetation zones occurs in the forest and juniper zones —about 20°, whereas mountain grasslands and steppes occupy gentler slopes from 10° to 17°, and the semideserts and the single desert patch lie on plains with an average slope of about 6° (Figure 31A2-8). The moderate baseflow of 38 mm and the high proportion of it contributed by ecosystems (94%) in the semidesert zone are most likely due to its location in areas with the gentlest relief and a high proportion of highly permeable soils. The only small desert patch remaining in Armenia exhibits moderate baseflow of 34 mm an extremely high proportion of baseflow provided by ecosystems (98%), probably because it is entirely located on soils with the highest permeability.

Figure 31A2-8. Average slope for vegetation zones (the zones are arranged by elevation for illustration only; in reality, the elevation distribution may differ).
2. ES changes from 2017 to 2023
All changes identified are determined only by changes in the landcover (Section 2.2.B). Weather and climate changes are not taken into account. The maps show that the changes are sporadic and oppositely directed (Figure 31A2-9). Nevertheless, overall, they can be characterized as negative. In cases where ES indicators changed significantly, baseflow (B) decreased while quick flow (QF) increased. This means that the ability of terrestrial ecosystems to sustain baseflow during dry periods is declining. The only exception is the Arpa basin, where B has increased.The most significant negative changes occurred in the Shirak province and the Akhuryan watershed corresponding to land cover changes in the Shirak province. The reason is the expansion of the croplands at the expense of the grasslands in the Shirak province (see here).
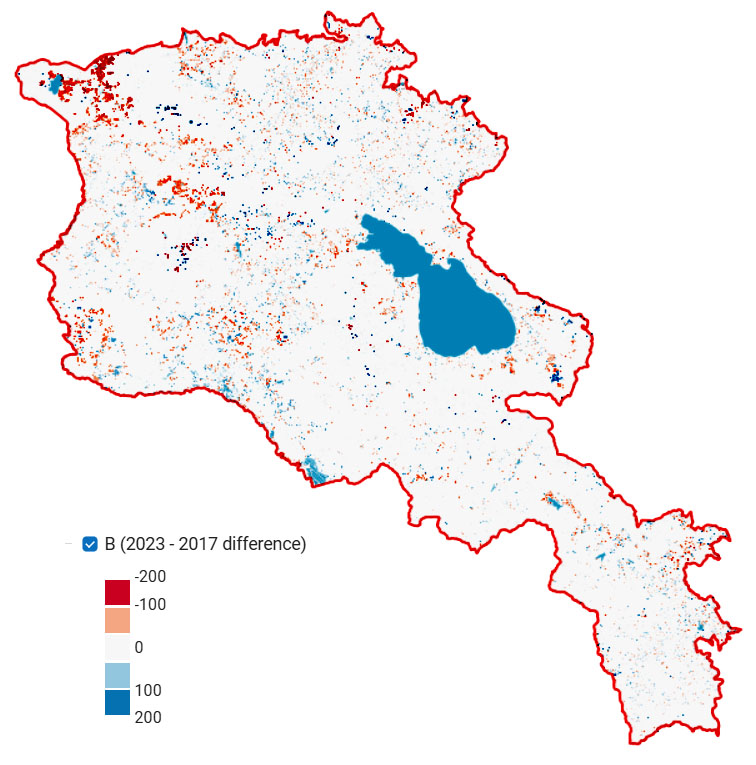
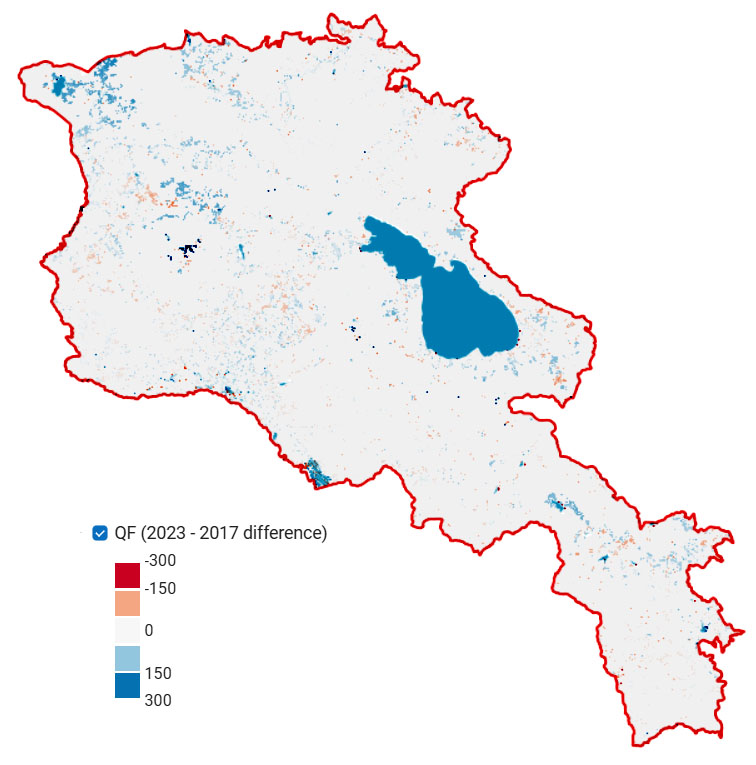
Figure 31A2-9. Changes in baseflow (a) and quickflow (b) from 2017 to 2023, mm. For detailed maps see sections “Seasonal Water Yield – Dynamics” in the project Web GIS
The most notable changes across watersheds and marzes are a decrease in baseflow and an increase in quickflow. These negative changes are most pronounced in the Akhuryan and Metsamor watersheds and in the marzes Shirak and Aragatsotn. A slight increase in baseflow is observed in the Arpa and Aghstev watersheds and in Ararat marz (Table 31A2-3; Figures 31A2-10 and 31A2-11).
Figure 31A2-10. Changes in baseflow and quick flow from 2017 to 2023 in absolute (a) and relative (b) indicators across watersheds
Figure 31A2-11. Changes in baseflow and quickflow from 2017 to 2023 in absolute (a) and relative (b) indicators across marzes
Table 31A2-3. Changes in baseflow and quick flow from 2017 to 2023 across watersheds and marzes
| Baseflow, mean | Quick flow, mean | ||||||||
| B 2017, mm | B 2023, mm | Change in B, mm | Change in B, % relative to 2017 | QF 2017, mm | QF 2023, mm | Change in QF, mm | Change in QF, % relative to 2017 | ||
| Watersheds | Aghstev | 42.1 | 42.4 | 0.2 | 0.6 | 87.3 | 87.6 | 0.3 | 0.3 |
| Akhuryan | 79.0 | 73.2 | -5.9 | -7.4 | 116.6 | 120.7 | 4.1 | 3.5 | |
| Arpa | 37.0 | 37.3 | 0.2 | 0.7 | 59.3 | 59.3 | 0.0 | 0.0 | |
| Debed | 78.6 | 78.3 | -0.3 | -0.4 | 114.3 | 115.6 | 1.3 | 1.1 | |
| Hrazdan | 53.5 | 53.4 | 0.0 | -0.1 | 131.4 | 132.0 | 0.6 | 0.5 | |
| Metsamor | 51.7 | 50.4 | -1.2 | -2.4 | 75.8 | 77.5 | 1.7 | 2.3 | |
| Vorotan | 31.0 | 31.0 | 0.0 | 0.1 | 78.6 | 79.2 | 0.5 | 0.7 | |
| Provinces | Aragatsotn | 62.5 | 61.0 | -1.5 | -2.5 | 88.5 | 90.5 | 2.0 | 2.2 |
| Ararat | 27.6 | 28.1 | 0.5 | 1.7 | 49.5 | 49.6 | 0.1 | 0.3 | |
| Armavir | 22.2 | 21.9 | -0.3 | -1.3 | 46.2 | 46.8 | 0.6 | 1.2 | |
| Gegharkunik | 54.6 | 54.5 | -0.1 | -0.1 | 150.5 | 151.1 | 0.6 | 0.4 | |
| Kotayk | 66.4 | 66.7 | 0.3 | 0.4 | 89.8 | 90.3 | 0.5 | 0.6 | |
| Lori | 74.1 | 74.0 | -0.2 | -0.2 | 114.5 | 115.8 | 1.3 | 1.2 | |
| Shirak | 91.3 | 85.1 | -6.2 | -6.8 | 121.3 | 125.7 | 4.4 | 3.6 | |
| Syunik | 30.9 | 30.9 | 0.0 | 0.1 | 78.6 | 79.1 | 0.5 | 0.7 | |
| Tavush | 36.7 | 36.9 | 0.1 | 0.3 | 86.2 | 86.3 | 0.1 | 0.1 | |
| Vayots Dzor | 39.3 | 39.4 | 0.1 | 0.3 | 66.0 | 66.0 | 0.0 | 0.0 | |
| Armenia | 52.0 | 51.3 | -0.7 | -1.3 | 97.0 | 98.0 | 1.0 | 1.1 | |
Cumulative baseflow (Bsum) in the lower reaches has decreased most in the Akhuryan River (-9.25%), and the Metsamor River (-3.03%), while in Voghji River it has visibly grown (+5.28%)
Changes in cumulative baseflow in the lower river reaches from 2017 to 2023
| Rivers | Bsum 2023, mm | Bsum 2017, mm | Changes, mm | Changes, % relative to 2017 |
| Aghstev | 686,063,872 | 685,638,016 | 425,856 | 0.06 |
| Akhuryan | 1,562,785,152 | 1,722,085,760 | -159,300,608 | -9.25 |
| Argichi | 75,929,520 | 75,653,040 | 276,480 | 0.37 |
| Arpa | 313,119,360 | 309,875,328 | 3,244,032 | 1.05 |
| Azat | 349,204,672 | 345,485,152 | 3,719,520 | 1.08 |
| Debed | 2,672,169,472 | 2,684,654,848 | -12,485,376 | -0.47 |
| Gavaraget | 422,896,480 | 425,799,968 | -2,903,488 | -0.68 |
| Hrazdan | 3,543,649,536 | 3,543,354,368 | 295,168 | 0.01 |
| Masrik | 43,279,976 | 42,957,568 | 322,408 | 0.75 |
| Metsamor | 1,676,233,984 | 1,728,691,072 | -52,457,088 | -3.03 |
| Vedi | 134,872,176 | 132,632,480 | 2,239,696 | 1.69 |
| Voghji | 75,920,344 | 72,110,264 | 3,810,080 | 5.28 |
| Vorotan | 300,472,096 | 300,990,784 | -518,688 | -0.17 |

3. Supply-use balance
Since the baseflow and quick flow values computed by the SWY model are, in accordance with the InVEST User Guide, relative measures, the baseflow volume VB was calculated as follows: VB=BFI⋅Vtot where Vtot is the river discharge according to the data reported by the Government of Armenia and ARMSTAT (Table below); BFI is baseflow index, BFI=B/(B+QF), where B and QF are baseflow and quick flow values computed by SWY model.
This analysis is approximate, because we used river flow data by watersheds and water-use data by provinces. The boundaries of provinces and watersheds largely coincide, which allows such a rough estimate. For watersheds that include two provinces, the data for those provinces were summed. Obviously, the balance should be refined in the future using data from the same EAAs.
| Watershed | River flow, millions of m3 | Data source | Details |
| Aghstev | 260 | ArmStat Regional Statistics handbooks 2023 https://armstat.am/en/?nid=651 | – |
| Akhuryan | 700.7 | Basin management plan https://www.arlis.am/hy/acts/112336 | River flow was calculated as the sum of utilizable river flow (506.2) and environmental flow (194.5). |
| Arpa | 1177.0 | Basin management plan https://www.arlis.am/hy/acts/112336 | The sum of river flows of Azat, Vedi, and Arpa |
| Debed | 960 | ArmStat Regional Statistics handbooks 2023 https://armstat.am/en/?nid=651 | – |
| Hrazdan | 712.2 | Basin management plan https://www.arlis.am/hy/acts/171449 | – |
| Metsamor | 777.8+265.5=1043.3 | Basin management plans https://www.arlis.am/hy/acts/171449 https://www.arlis.am/hy/acts/112336 | Total river flow was calculated as the sum of Qasagh (265.5) and Metsamor (777.8) rivers. Metsamor river flow wascalculated as the sum of utilizable river flow (1,786.7) and environmental flow (106.0) excluding water available from the reach downstream of the confluence of the Araks and Akhuryan rivers (1,114.9). |
| Vorotan | 1319.6 | Basin management plan https://www.arlis.am/hy/acts/106124 | The sum of river flows of Southern BMA |
The overwhelming majority of water consumption is accounted for by the agriculture, fisheries, and forestry sector, which underscores the importance of assessing the ecosystem service of baseflow provision. In two watersheds —Metsamor and Arpa—agricultural water consumption exceeds the baseflow volume (Figure 31A2-12a). In the Metsamor and Arpa watersheds, baseflow provides 56% and 55% of agricultural water consumption, respectively; in the Hrazdan watershed baseflow slightly exceeds agricultural consumption—by 16%. In the other watersheds baseflow exceeds water consumption by many times (Figure 31A2-12c). The water-use data for Tavush marz used in the analysis pertain to an area larger than the Aghstev River watershed for which river flow data are available. Therefore, in reality the total river flow from the entire area exceeds water consumption even more than indicated by these results.
Figure 31A2-12. Supply–consumption balance of ES: (a) river flow, baseflow and water consumption across watersheds (* data reported by ARMSTAT and the Government); (b) Difference between baseflow volume and water consumption in agriculture, fishery and forestry; (c) Share of baseflow in agriculture, fisheries and forestry water consumption (%).
Table 31A2-5. Supply–use balance of ES
| Water use in agriculture, fish breeding, forestry*, millions of m3 | Total water consum-ption*, millions of m3 | Baseflow, millions of m3 | River flow*, millions of m3 | Difference between baseflow volume and water consumption in agriculture, fishery and forestry, millions of m3 | Share of baseflow in agriculture, fisheries and forestry water consumption (%) | |
| Aghstev (a part of the marz Tavush) | 11.10 | 20.90 | 84.78 | 260.00 | 73.68 | 763.78 |
| Akhuryan (marz Shirak) | 53.00 | 63.10 | 264.46 | 700.70 | 211.46 | 498.99 |
| Arpa (marzes Ararat and Vayots Dzor) | 820.30 | 835.90 | 454.50 | 1177.00 | -365.80 | 55.41 |
| Debed (marz Lori) | 3.00 | 18.00 | 387.69 | 960.00 | 384.69 | 12923.03 |
| Hrazdan (marzes Kotayk and Gegharkunik) | 176.10 | 218.60 | 205.13 | 712.20 | 29.03 | 116.49 |
| Metsamor (marzes Armavir and Aragatsotn) | 740.40 | 769.10 | 411.06 | 1043.30 | -329.34 | 55.52 |
| Vorotan (marz Syunik) | 6.00 | 89.50 | 371.51 | 1319.60 | 365.51 | 6191.75 |
*Data reported by ARMSTAT and the Government of Armenia
4. A small by-product for education
The Seasonal Water Yield module requires data on the distribution of monthly precipitation across the territory of Armenia. However, the module does not account for the snow period when snow does not melt, and, consequently, there is no liquid precipitation. To address this, we have estimated the amount of liquid precipitation in Armenia by months. In addition to being used in the model, these results may be useful in explaining the climate characteristics of Armenia to a wider audience.
References
Hamel, P., Valencia, J., Schmitt, R., Shrestha, M., Piman, T., Sharp, R. P., Francesconi, W., & Guswa, A. J. (2020). Modeling seasonal water yield for landscape management: Applications in Peru and Myanmar. Journal of Environmental Management, 270, 110792. https://doi.org/10.1016/j.jenvman.2020.110792