Ecosystem extent in protected areas
Extent of protected areas in Armenia
In accordance with Decree N 1059-Ա (25.09.2014) of the Government of the Republic of Armenia, the PAs in 2014 were as follows:
– 3 state reserves (“Khosrov Forest”, “Shikahogh” and “Erebuni”), which occupy an area of 35,439.6 hectares or 1.19% of the total area of Armenia,
– 4 national parks (“Sevan”, “Dilijan”, “Lake Arpi” and “Arevik”), which occupy an area of 236,802.1 hectares or 7.96% of the total area of Armenia,
– 232 natural monuments,
– 27 state sanctuaries, which occupy an area of 114,812.7 hectares or 3.95% of the total area of Armenia.
The total area of state reserves, sanctuaries, and national parks was 387,054.4 hectares, which accounted for 13.1% of Armenia’s total territory.
Table 1. PAs areas in 2014 according to the Ministry of Environment of Armenia
| PA | Area, ha |
| STATE RESERVES | |
| Khosrov Forest | 23 213.5 |
| Shikahogh | 12 137.1 |
| Erebuni | 89.0 |
| NATIONAL PARKS | |
| Sevan | 147 455.0 |
| Dilijan | 33 765.0 |
| Lake Arpi | 21 179.3 |
| Arevik | 34 401.8 |
| NATURAL SANCTUARIES | |
| Akhnabad | 25.0 |
| Arjatkhlenu | 40.0 |
| Juniper sparse forest | 3 312.0 |
| Gyulagarak | 2 576.0 |
| Herher sparse forest | 6 139.0 |
| Jermuk Forest | 3 865.0 |
| Sosu Park | 64.2 |
| Aragats Alpine | 300.0 |
| Banks pine | 4.0 |
| Goravan sand dunes | 95.99 |
| Caucasian rosehip | 1 000.0 |
| Arzakan-Meghradzor | 13 532.0 |
| Gandzakar | 6 813.0 |
| Getik | 5 728.0 |
| Ijevan | 5 908.0 |
| Margahovitti | 3 368.0 |
| Yeghegnadzor | 4 200.0 |
| Goris | 1850.0 |
| Red worm | 219.85 |
| Boghakar | 2 728.0 |
| Black Lake | 240.0 |
| Deep wound | 50.28 |
| Hanqavan Hydrological | 5 169.04 |
| Jermuk Hydrological | 17 371.0 |
| Zangezur | 25 870.64 |
| Zikatar | 150.0 |
| Khustup | 6946.74 |
Ecosystem extent in PAs
At the present stage, we do not have access to official data covering all Armenian PAs for the period after 2014, official digitized maps of PA boundaries, or land cover data specifically refined for the territory of Armenia. Therefore, the following analyses are based on the available digital PA map referenced below and the global ESRI land cover dataset. The use of the ESRI land cover dataset for relatively small PA areas leads to significant errors in area estimation. In the examples below, we demonstrate only the type of analysis that can, in principle, be conducted for ecosystem accounting of PAs based on land cover data. All estimates are of methodological value only and should be refined using official PA boundaries and land cover data provided by the PAs.
This example of accounting for protected areas (PAs) is based on the PA map provided by Acopian Center for the Environment, American University of Armenia and the vegetation map prepared by Aleksanyan Alla (Institute of Botany after A. Takhtajyan NAS RA) and Asatryan Vardan (Scientific center of zoology and hydroecology of NAS RA), and ESRI land cover data from 2017 and 2023.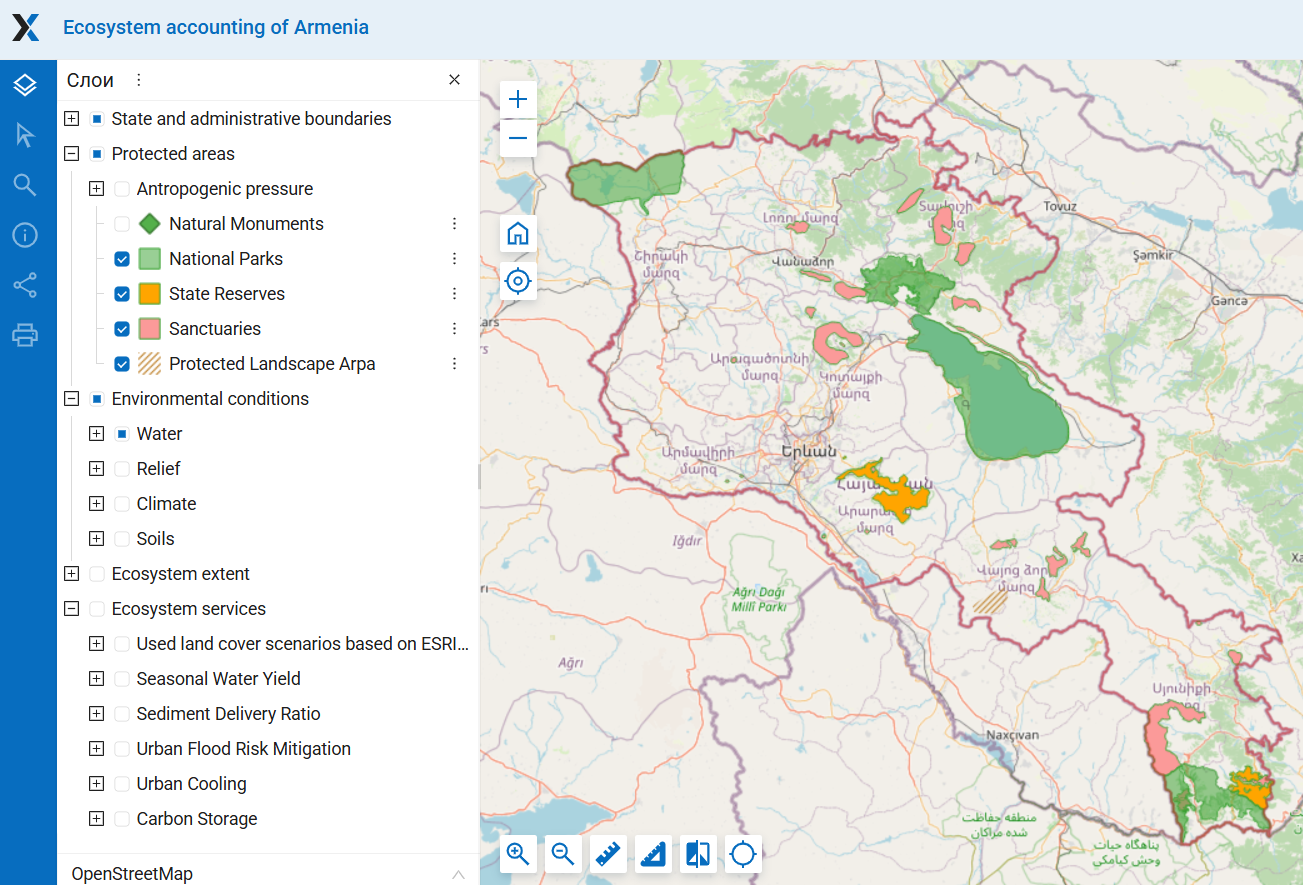
Figure 1. The map of protected areas of Armenia (for details see section Protected areas here). (The location of the Goravan Sands Sanctuary needs to be clarified)
The extent of land-cover classes in the PAs indicates the area of woody vegetation and the degree of human-induced transformation (Figure 2; Table 2). According to ESRI (2023), the entire area of the Ararat Vordan Karmir Sanctuary is occupied by croplands and built-up areas. Human-modified territories cover about half of the Goravan Sands and Goris Sanctuaries. The areas of Sevan and Arpi Lake National Parks, as well as the Khor Virap Sanctuary, are also significantly transformed. Forest vegetation occupies most of the territory of the Shikahogh Reserve and the Dilijan National Park, as well as the Gandzakar–Upper Aghdan, Ijevan, Pine of Gyulagarak, and Zikatar Sanctuaries. By contrast, forest is almost absent in the Erebuni Reserve, Arpi Lake National Park, and in 11 other sanctuaries.

Figure 2. The share of area of land cover classes and anthropogenic areas, %.
*Arpa is protected landscape
Table 2. Area of land cover classes in PAs, ha
(* the total area of PAs shown on the map used may differ from the official data, as the PA boundaries on the map require further clarification)
| PA type | PA | Trees | Rangeland | Bare Ground | Snow/Ice | Water and flooded vegetation | Crops | Built-up area | Total area of PA* |
| State Reserves | Erebuni | 0 | 84.84 | 0 | 0 | 0 | 0 | 3.5 | 88.30 |
| Khosrov Forest | 2404.91 | 20231.17 | 31.76 | 0 | 0.51 | 5.33 | 176.63 | 22868.59 | |
| Shikahogh | 9854.31 | 1937.14 | 0 | 0 | 0 | 0 | 0 | 11810.26 | |
| National Parks | Sevan | 5525.1 | 14346.23 | 13.23 | 0 | 126863.3 | 2173.48 | 2336.68 | 151374.99 |
| Dilijan | 24757.79 | 12862.58 | 0 | 0 | 5.21 | 11.41 | 1546.26 | 39214.50 | |
| Arpi Lake | 186.33 | 43922.3 | 8.64 | 0 | 2123.82 | 10719.45 | 810.1 | 57828.90 | |
| Arevik | 4158.48 | 37530.44 | 36.28 | 1.25 | 3.11 | 0 | 5.12 | 41852.62 | |
| Protected landscape | Arpa | 1.49 | 8148.12 | 1.01 | 0 | 0 | 0 | 1.7 | 8158.56 |
| State Sanctuaries | Akhnabat Yew Grove | 0 | 24.85 | 0 | 0 | 0 | 0 | 0 | 24.86 |
| Aragats Alpine | 0 | 276.72 | 0.17 | 4.1 | 15.67 | 0 | 4.11 | 301.07 | |
| Ararat Vordan Karmir | 0 | 0.37 | 0 | 0 | 0 | 166.63 | 38.36 | 205.60 | |
| Arzakan and Meghradzor | 7503.25 | 6181.2 | 3.39 | 0 | 7.27 | 285.16 | 521.26 | 14518.08 | |
| Boghaqar | 1112.76 | 1757.96 | 0 | 0 | 0 | 0 | 0 | 2872.27 | |
| Caucasian Rose-Bay | 1037.93 | 794.25 | 0 | 0 | 0 | 0 | 15.02 | 1848.58 | |
| Gandzakar-Upper Aghdan | 2973.96 | 925.74 | 0 | 0 | 0 | 0.07 | 7.73 | 3910.26 | |
| Getik | 1354.88 | 1559.37 | 0.03 | 0 | 1.65 | 58.24 | 148.68 | 3124.67 | |
| Gilan | 48.48 | 238.6 | 0.23 | 0 | 0 | 0 | 0 | 287.41 | |
| Goravan Sands | 0 | 106.47 | 0 | 0 | 0 | 106.93 | 0 | 213.47 | |
| Goris | 11.93 | 934.73 | 0 | 0 | 0 | 847.96 | 96.39 | 1901.05 | |
| Hankavan Hydrological | 191.05 | 783.42 | 0 | 0 | 0 | 0 | 1.3 | 976.53 | |
| Hazel-Nut | 0 | 40.73 | 0 | 0 | 0 | 0.58 | 0.24 | 41.48 | |
| Herher Open Woodland | 7.17 | 2047.41 | 6.58 | 0 | 35.85 | 0 | 0 | 2098.67 | |
| Ijevan | 5725.75 | 2048.54 | 0 | 0 | 0 | 5.7 | 7.29 | 7793.64 | |
| Jermuk | 726.01 | 3336.61 | 0 | 0 | 0 | 0.94 | 0 | 4066.48 | |
| Jermuk Hydrological | 388.69 | 2163.31 | 0 | 0 | 0.05 | 0 | 28.1 | 2581.86 | |
| Juniper Open Woodlands of Sevan | 8.9 | 3764.79 | 21.6 | 0 | 0.2 | 60.96 | 70.75 | 3930.40 | |
| Khor Virap | 0.01 | 124.8 | 0 | 0 | 0.28 | 31.71 | 2.45 | 159.37 | |
| Margahovit | 2285.4 | 2222.63 | 0 | 0.14 | 0 | 69.85 | 23.13 | 4604.38 | |
| Pine of Banx | 0 | 4.62 | 0 | 0 | 0 | 0 | 0 | 4.61 | |
| Pine of Gyulagarak | 1768.24 | 661.81 | 0 | 0 | 0 | 14.27 | 0.61 | 2446.95 | |
| Plane Grove | 1098.25 | 1049.34 | 0 | 0 | 0 | 1.43 | 13.58 | 2174.57 | |
| Sev Lich | 0 | 150.56 | 0.47 | 0 | 89.14 | 0 | 0 | 240.32 | |
| Yeghegis | 230.75 | 1927.08 | 0.45 | 0 | 0 | 0.52 | 36.32 | 2196.95 | |
| Zangezur | 127.06 | 24156.19 | 241.24 | 3.54 | 33.9 | 2.03 | 0 | 24711.29 | |
| Zikatar | 2691.57 | 504.37 | 0 | 0 | 0 | 0 | 0 | 3198.61 |
All vegetation zones are represented in the PAs. The area of some PAs is entirely covered by vegetation of a single zone, for example: Goravan Sands – desert; Erebuni, Ararat, and Khor Virap — semi-desert; Hazel Nut – broadleaf woodlands; Gandzakar-Upper Aghdan, Goris, Hankavan Hydrological, Pine of Gyulagarak, Plane Grove – forest zone; Akhnabat Yew Grove, Pine of Banx, Sev Lich — subalpine meadows; Aragats Alpine – alpine meadows (Figure 3).
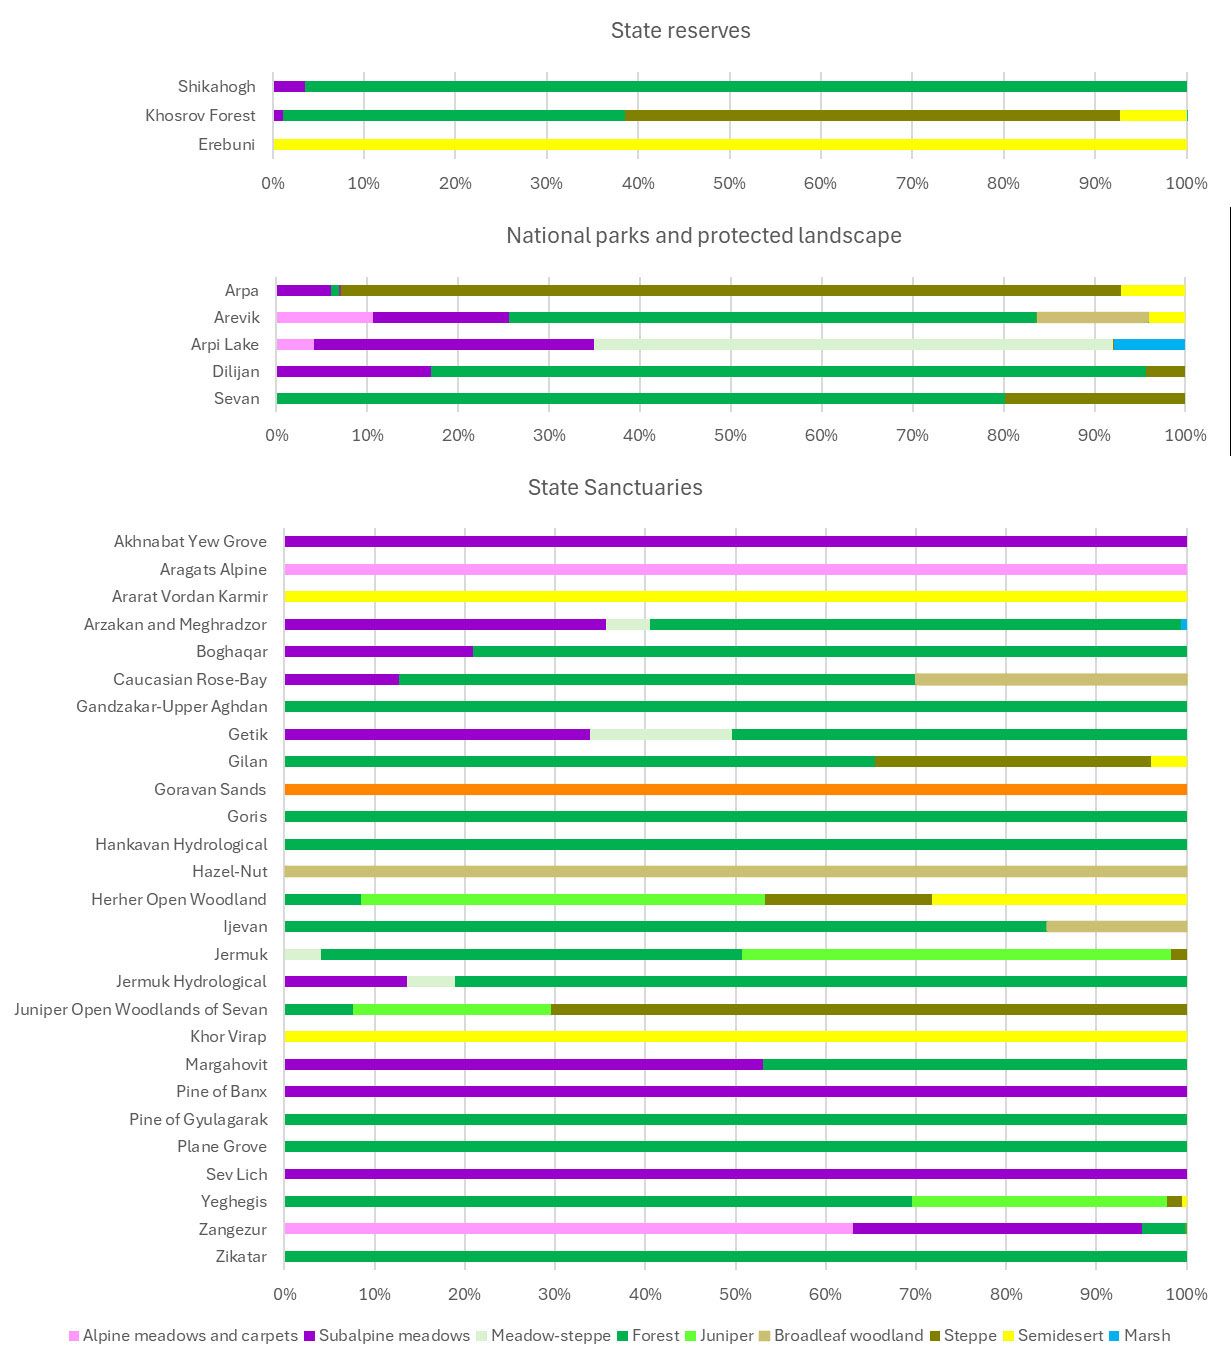
Figure 3. The share of area of vegetation zones in PAs, %
Table 3. Area of vegetation zones in PAs, ha
(* the total area of PAs shown on the map used may differ from the official data, as the PA boundaries on the map require further clarification)
| PA type | PA | Alpine meadows and carpets | Subalpine meadows | Meadow-steppe | Forest | Juniper | Broadleaf woodland | Steppe | Semi-desert | Marsh | No data | Total area of PA* |
| State Reserves | Erebuni | 0 | 0 | 0 | 0 | 0 | 0 | 0 | 88.34 | 0 | 0 | 88.34 |
| Khosrov Forest | 0 | 268.64 | 0 | 8533.69 | 0 | 14.72 | 12399.13 | 1626.9 | 3.58 | 3.65 | 22850.31 | |
| Shikahogh | 0 | 405.25 | 0 | 11224.97 | 0 | 0 | 0 | 0 | 0 | 176.04 | 11806.26 | |
| National Parks | Sevan | 0 | 0 | 16.03 | 20957.52 | 0 | 0 | 5204.09 | 0 | 0 | 125080.4 | 151258.04 |
| Dilijan | 0 | 6667.11 | 15.37 | 30799.09 | 0 | 0 | 1701.68 | 0 | 0 | 0 | 39183.25 | |
| Arpi Lake | 2375.27 | 17575.65 | 32567.51 | 0 | 0 | 0 | 40.31 | 0 | 4514.36 | 726.23 | 57799.33 | |
| Arevik | 4371.3 | 6231.62 | 0 | 23943.92 | 0 | 5172.4 | 0 | 1651.39 | 0 | 461.27 | 41831.9 | |
| Protected landscape | Arpa | 0 | 490.08 | 0 | 73.14 | 17.23 | 0 | 6997.61 | 574.26 | 0 | 0 | 8152.32 |
| State Sanctuaries | Akhnabat Yew Grove | 0 | 24.85 | 0 | 0 | 0 | 0 | 0 | 0 | 0 | 0 | 24.85 |
| Aragats Alpine | 300.77 | 0 | 0 | 0 | 0 | 0 | 0 | 0 | 0 | 0 | 300.77 | |
| Ararat Vordan Karmir | 0 | 0 | 0 | 0 | 0 | 0 | 0 | 205.36 | 0 | 0 | 205.36 | |
| Arzakan and Meghradzor | 1.87 | 5171.99 | 699.07 | 8547.13 | 0 | 0 | 0 | 0 | 86.52 | 0 | 14506.58 | |
| Boghaqar | 0.32 | 600.73 | 0 | 2269.67 | 0 | 0 | 0 | 0 | 0 | 0 | 2870.72 | |
| Caucasian Rose-Bay | 0 | 235.19 | 0 | 1051.5 | 0 | 560.51 | 0 | 0 | 0 | 0 | 1847.2 | |
| Gandzakar-Upper Aghdan | 0 | 0 | 0 | 3907.5 | 0 | 0 | 0 | 0 | 0 | 0 | 3907.5 | |
| Getik | 0 | 1057.62 | 491.27 | 1573.96 | 0 | 0 | 0 | 0 | 0 | 0 | 3122.85 | |
| Gilan | 0 | 0 | 0 | 187.18 | 0 | 0 | 87.72 | 11.24 | 0 | 1.17 | 287.31 | |
| Goravan Sands | 0 | 0 | 0 | 0 | 0 | 0 | 0 | 213.4 | 0 | 0 | 213.4 | |
| Goris | 0 | 0 | 0 | 1900.32 | 0 | 0 | 0 | 0 | 0 | 0 | 1900.32 | |
| Hankavan Hydrological | 0 | 0 | 0 | 975.77 | 0 | 0 | 0 | 0 | 0 | 0 | 975.77 | |
| Hazel-Nut | 0 | 0 | 0 | 0 | 0 | 41.55 | 0 | 0 | 0 | 0 | 41.55 | |
| Herher Open Woodland | 0 | 0 | 0 | 177.97 | 938.57 | 0 | 388.05 | 592.42 | 0 | 0 | 2097.01 | |
| Ijevan | 0 | 0 | 0 | 6581.18 | 0 | 1206.1 | 0 | 0 | 0 | 0 | 7787.28 | |
| Jermuk | 0 | 0 | 164.7 | 1896.6 | 1932.97 | 0 | 69.29 | 0 | 0 | 0 | 4063.56 | |
| Jermuk Hydrological | 0 | 351.27 | 136.5 | 2092.38 | 0 | 0 | 0 | 0 | 0 | 0 | 2580.15 | |
| Juniper Open Woodlands of Sevan | 0 | 0 | 0 | 298.17 | 861.83 | 0 | 2767.2 | 0 | 0 | 0 | 3927.2 | |
| Khor Virap | 0 | 0 | 0 | 0 | 0 | 0 | 0 | 159.25 | 0 | 0 | 159.25 | |
| Margahovit | 0 | 2440.85 | 0 | 2160.31 | 0 | 0 | 0 | 0 | 0 | 0 | 4601.16 | |
| Pine of Banx | 0 | 4.62 | 0 | 0 | 0 | 0 | 0 | 0 | 0 | 0 | 4.62 | |
| Pine of Gyulagarak | 0 | 2.62 | 0 | 2442.31 | 0 | 0 | 0 | 0 | 0 | 0 | 2444.93 | |
| Plane Grove | 0 | 0 | 0 | 2160.46 | 0 | 0 | 0 | 0 | 0 | 12.97 | 2173.43 | |
| Sev Lich | 0.07 | 240.1 | 0 | 0 | 0 | 0 | 0 | 0 | 0 | 0 | 240.17 | |
| Yeghegis | 0 | 0 | 0 | 1527.23 | 619.04 | 0 | 37.75 | 11.1 | 0 | 0 | 2195.12 | |
| Zangezur | 15340.85 | 7825.73 | 0 | 1148.02 | 0 | 45.62 | 0 | 0 | 0 | 336.57 | 24696.79 | |
| Zikatar | 0 | 0 | 0 | 3195.94 | 0 | 0 | 0 | 0 | 0 | 0 | 3195.94 |
Overall, vegetation zones are unevenly represented in the PAs. The forest zone occupies the largest area within the PAs—about 1,400 km². Other zones are much smaller, ranging from 500 km² of subalpine zone to 46 km² of marshes (Figure 26B-4 a). The shares of the zones’ areas preserved in the PAs are also highly unequal. 26% and 32% of the forest and juniper zones are preserved in the PAs while for the semi-desert, steppe, and open woodland zones this share is less than 10% (Figure 26B-4 b). The desert zone is not indicative in this analysis, as it is represented by only one small unique site).
Between the total area of a vegetation zone and the share of its area preserved in the PAs, a weak, non-significant tendency towards a negative relationship between the total zonearea of a vegetation zone and its representation in the PAs: the larger the total area of a zone, the lower its representation in the PAs (Figure 26B-5). Even from this weak trend it is possible to distinguish zones that are better represented in the PAs, lying above the trend line (juniper, forest), and underrepresented zones, lying below the trend line (semi-desert, broadleaf woodland).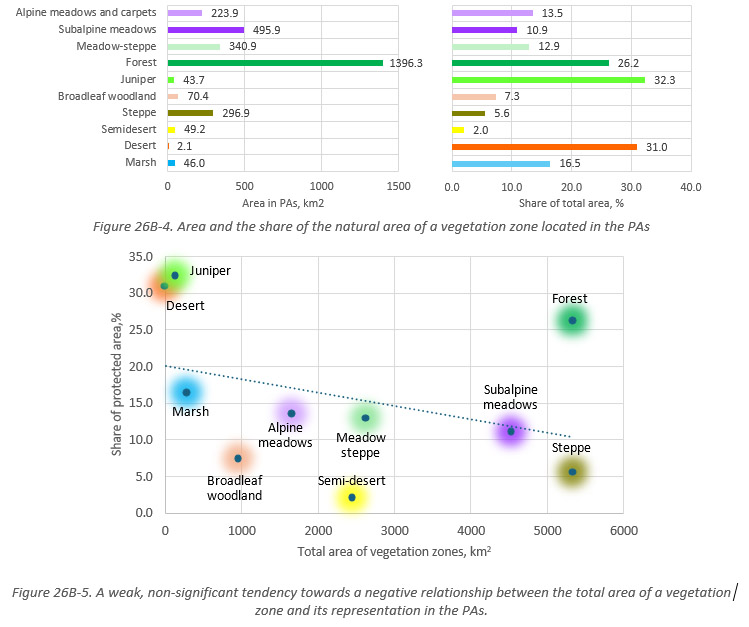
Changes in the area of land cover classes from 2017 to 2023
According to ESRI, between 2017 and 2023 the most notable changes occurred in Arpi Lake National Park, where the area of croplands increased by more than half, and in the Erebuni Reserve, where it decreased by one third. In the Arevik Reserve, the forest area decreased by 18% (Figure 26C-1).
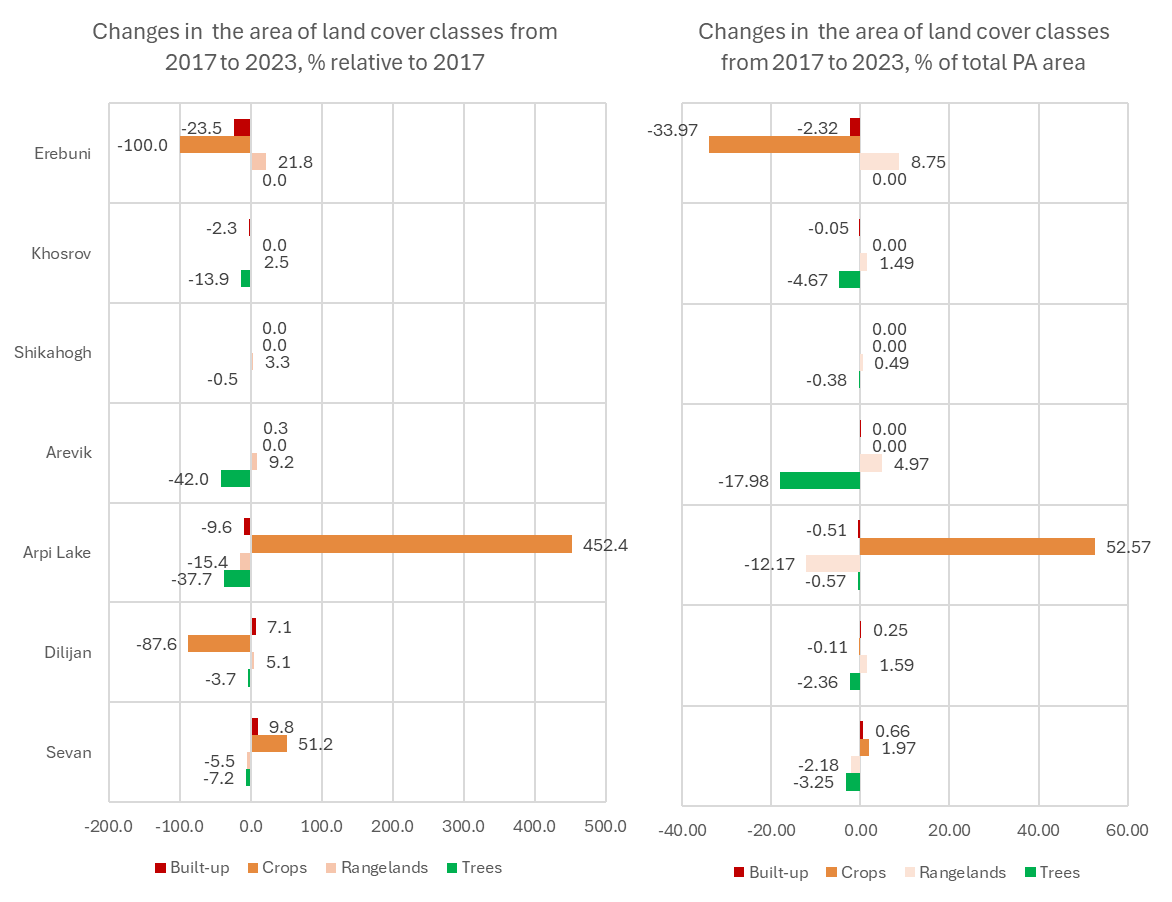
Figure 26C-1. Changes in the area of land cover classes within PAs
2.6.D. Distance from natural monuments to anthropogenic areas and roads
As an example of assessing anthropogenic threats to ‘point’ ecosystems and natural objects of very small area, distances were measured between the natural monuments shown on the PA map provided by Acopian Center for the Environment, American University of Armenia, and anthropogenic areas (built-up areas and croplands according to the ESRI 2023 land cover), roads (including main roads and all other roads including trails from the dataset of Forest Atlas of Armenia), and population polygons with more than 100 residents (based on the Kontur Population Dataset).
This example shows, that even minor errors in land cover classification—amounting to just a few pixels—can significantly distort the calculated distances to natural monuments. Therefore, to obtain reliable results, it is essential to use land cover data specifically refined for Armenia.
Figure 26D-1. The map of natural monuments used (in details see here Section Protected Areas)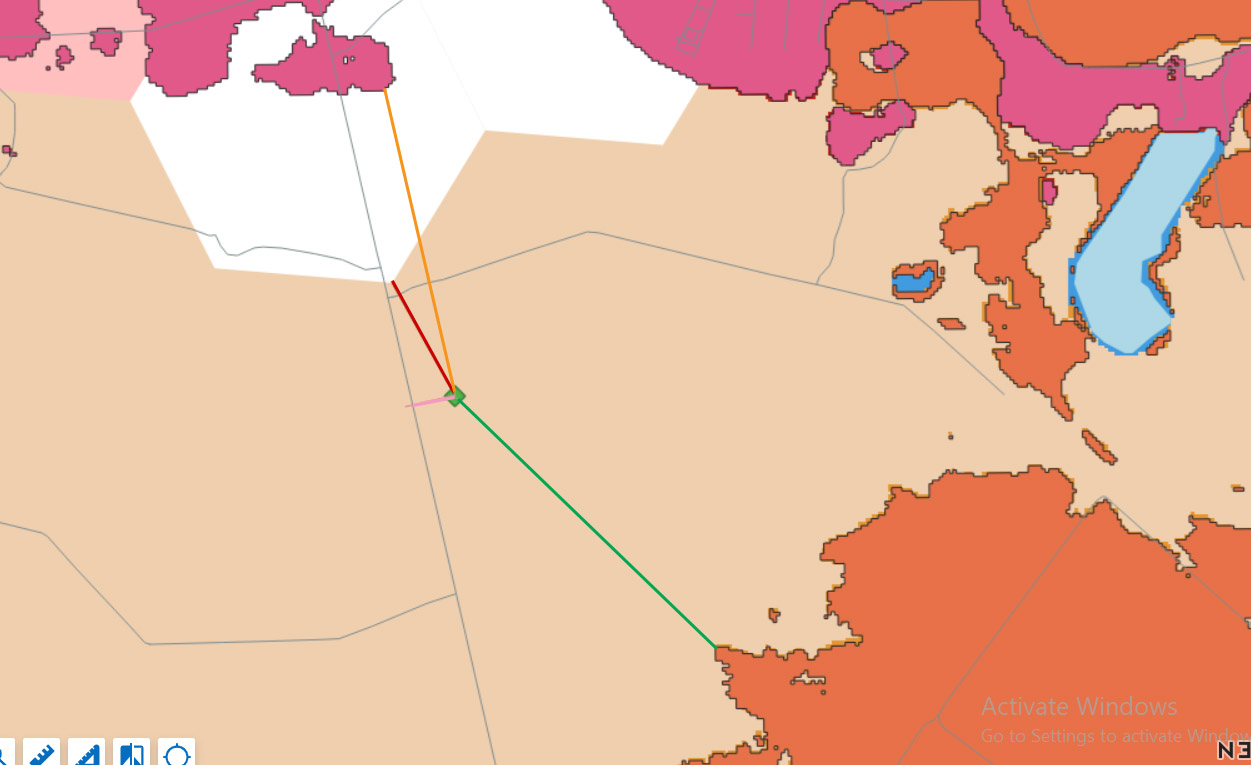
Figure 26D-2. An Example of distances for Dasak Biological Monument in Armavir marz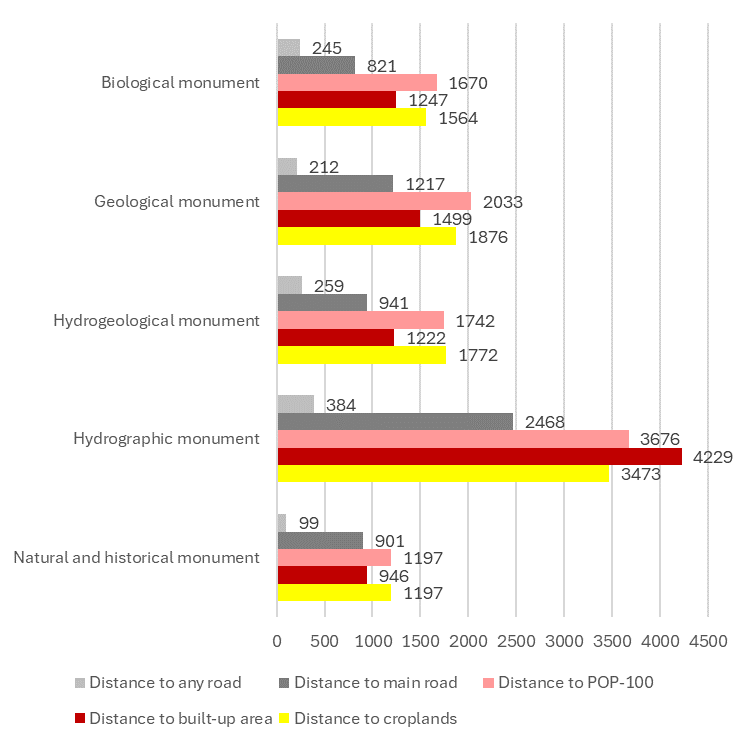
Figure 26D-3. Distance from different categories of natural monuments to various types of anthropogenic areas and roads, in meters.
Pop-100 – hexagons with a population of more than 100 people.
Unfortunately, at this stage the lack of an officially approved digital map of PA boundaries, combined with errors in the ESRI land-cover data, prevents accurate accounting of ecosystem extent within PAs. For PAs with small areas, even minor land-cover errors can significantly distort the actual proportions of different ecosystem types. Moreover, the misclassification of anthropogenic areas where none exist leads to inaccurate assessments of threats to natural ecosystems and natural monuments. For instance, the misclassification of cropland and built-up areas in the high-mountain zone of the Gegham Ridge in the land-cover data artificially reduced the estimated distance between natural monuments and anthropogenic territories.
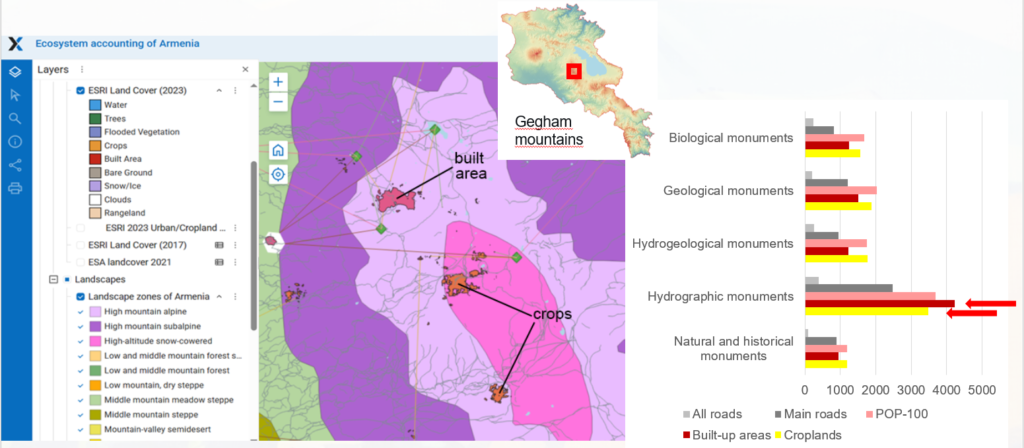
Figure 26D-4. Erroneous underestimation of the distance between anthropogenic areas and hydrographic monuments due to ESRI land cover mistakenly detecting croplands and built-up areas on the Gegham Ridge.