Area of land cover classes in the tested datasets
To ensure dataset comparability, all tested land cover datasets and Governmental data on land cover area were generalized into five land cover classes: 1) trees; 2) non-woody natural areas; 3) water, wetlands, flooded vegetation; 4) crops; 5) built-up areas.
The Decision of the Government of the Republic of Armenia in April 11, 2019 defined the following land cover classes for national accounting: Cultivated lands; Grasslands; Tree-covered areas; Shrub-covered areas; Water covered areas; Vegetation-free areas. The more detailed disaggregation of the Vegetation-free class by land fund categories provided in the Government-reported data, enables the separation of vegetation-free anthropogenic areas, i.e., built-up areas from natural ones (see here) and makes it possible to compare Government-reported data and land cover datasets. Further, to ensure comparability of tested datasets and Government-reported data three land cover classes – Grasslands, Shrub-covered areas, and Vegetation-free natural areas – were combined into one class Non-woody natural areas. The data for 2022 were used for comparison, as it represents the midpoint between the dates of the tested land cover datasets.
Share of land cover classes in Armenia
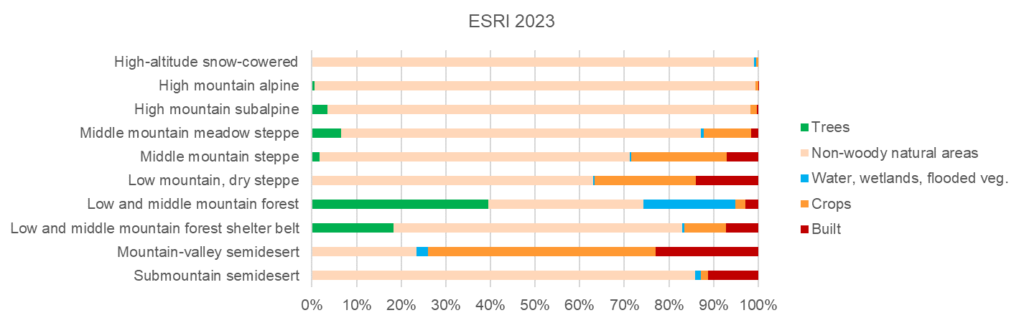
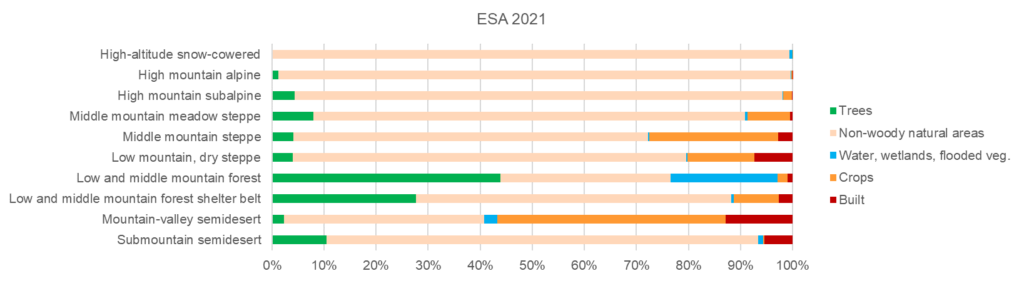
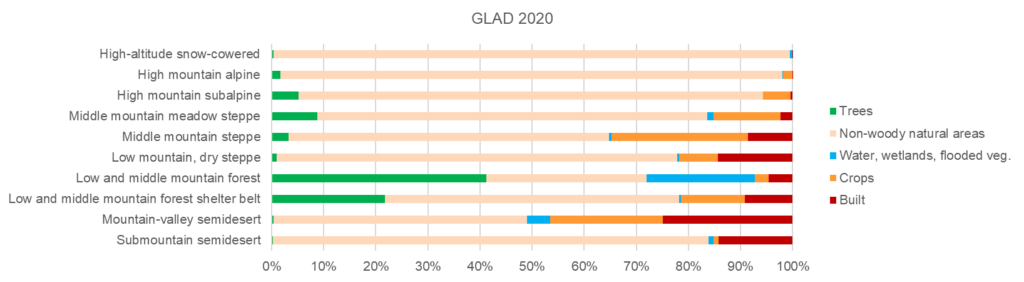
GLC_FCS30D landcover data shows very strong excess of cropland area and excess of forest area. The results of the three land cover datasets — ESRI, ESA, and GLAD — are similar and show a smaller cropland area nd larger grassland area than the Government-reported data. In contrast, the DW dataset shows a larger cropland area and smaller grassland area than the Government data (Fig. 1, 2).
Dataset GLC_FCS30D 2022 was excluded from the further analysis, as it differed most significantly from all the other datasets and from Government-reported data.
Figure 1. Share of land cover classes in Armenia according tested datasets
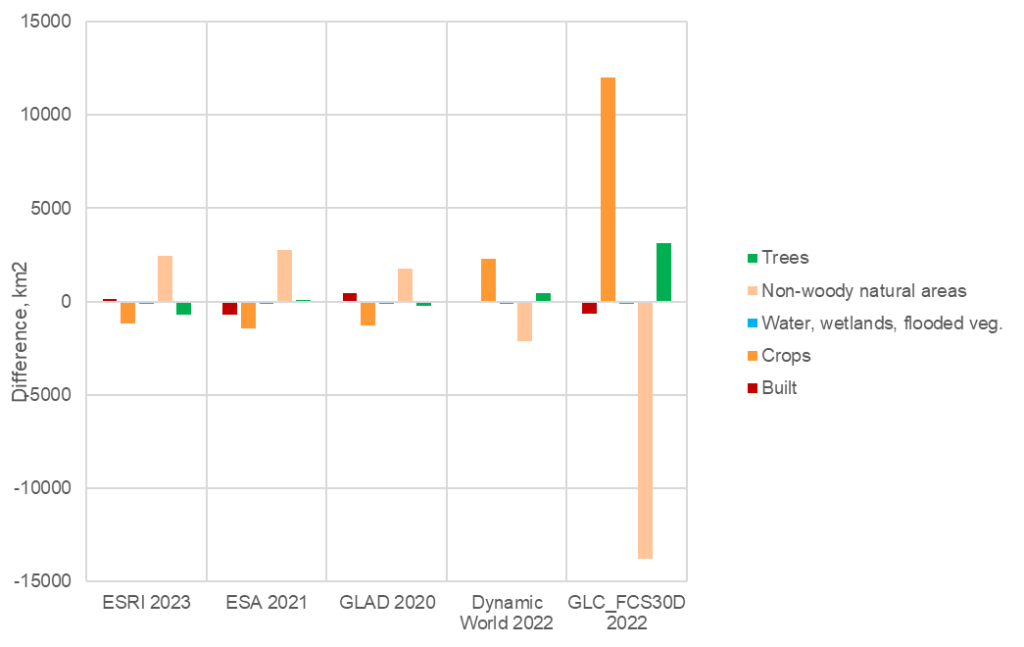
Figure 2. Difference between Government-reported area of land cover classes (2022) and area and data of tested datasets
Share of land cover classes across marzes
All four remaining datasets differ significantly from the Government-reported data (Fig. 3).  Figure 3. Shares of land cover classes across marzes in tested datasets and Government-reported data
The discrepancies identified at the national level are largely maintained across individual marzes: ESRI, ESA, and GLAD show larger areas of non-woody natural lands and smaller cropland areas compared to the Government data. In contrast, DW shows smaller non-woody areas and larger cropland areas than the Government data (Fig. 4). This shift persists across the majority of marzes (Fig. 4), suggesting that it is systemic and driven by the differences in the methodology used for satellite image classification.
Discrepancies between the land cover datasets and Government data for forest cover and built-up areas are smaller in magnitude and do not follow the pattern observed in the relationship between cropland and non-woody natural areas. The most prominent shifts include for forest area a reduction in the ESRI data, and increase in the DW data, as well as for built-up area a reduction in the ESA data and increase in the GLAD data. Differences between the land cover datasets and the Government data in terms of water area are minor and fairly consistent across all datasets — each identifies a slightly smaller water area.
Figure 5 provides a more detailed view of the area differences across the marzes.
Figure 4. Land cover area difference: Government-reported areas minus areas from tested datasets. Differences between tested datasets and Government-reported data in marzes are shown in different colors. Provincial differences for each land cover class are combined into a single bar to show the total deviation from the Government-reported data. Figure 5. Land cover area difference across marzes: Government-reported areas minus areas from tested datasets
The absolute discrepancy (km2) is largest for croplands and grasslands, while in relative terms (percentage relative to Government-reported data), it is greatest for croplands and built-up areas (Figure 6). Figure 6. Absolute (km²) and relative discrepancy (% relative to Government-reported data) in area of land cover classes
The smaller area of built-up area in ESA data can be explained by the fact that ESA identifies trees, grasslands, and crops within settlements. The ESA data generally feature smaller patches across all land cover classes (Fig. 7).
Figure 7. The same area as represented in different land cover datasets
The Government classification of land cover types includes, among others, shrub-covered areas. Of the four land cover datasets retained for analysis, two — ESA and DW — also include this class. However, the shrub areas identified in these datasets differ greatly from the Government-reported areas. According to ESA, shrub area is very small and consistently lower than the Government figures across all marzes. DW, on the contrary, identifies a very large shrub area — several times greater than the Government data (Table 1, Fig. 8). Thus, the presence of a “shrubs” class in these two datasets does not make them more consistent with the Government data. 
Figure 8. Discrepancy with Government-reported data in shrubland area.
Table 1. Area of shrub-covered areas in Government-reported data and in two land cover datasets
| Marzes | GOV 2022 | ESA 2021 | DW 2022 |
| Aragatsotn | 3.925 | 0.000 | 361.594 |
| Ararat | 24.962 | 0.001 | 387.490 |
| Armavir | 6.341 | 0.001 | 58.548 |
| Gegharkunik | 36.351 | 0.000 | 611.396 |
| Kotayk | 23.135 | 0.000 | 372.450 |
| Lori | 48.307 | 0.057 | 345.520 |
| Shirak | 0.000 | 0.000 | 246.146 |
| Syunik | 157.423 | 1.042 | 1147.185 |
| Tavush | 29.433 | 8.913 | 310.120 |
| Vayots Dzor | 11.479 | 0.000 | 843.881 |
A preliminary overall indicator for assessing land cover data accuracy can be the total discrepancy between land cover class areas in datasets and Government data. The reliability of this indicator increases when absolute errors are summed across the smallest spatial units. In this case, however, data are available only at the marz level, so the indicator we used represents the sum of absolute area discrepancies (by modulus, regardless of sign) across marzes. Overall, all four datasets show a similar total discrepancy from the Government data, ranging from 19.4% to 20.9% of Armenia’s total area. The smallest discrepancy is observed in the ESRI dataset, and the largest in ESA (Fig.9).
Figure 9. Total relative discrepancy (% relative to total area of Armenia) between tested datasets and Government-reported data
Share of land cover classes across landscape zones
A comparison of land cover class areas across landscape zones according different datasets shows that ESRI, ESA, and GLAD are generally similar to each other (Fig. 9). Dynamic World (DW 2022) data show a significantly larger cropland area compared to the other datasets. This is especially noticeable in mountainous landscapes Croplands were identified on nearly 10% of the area of the high-altitude and alpine zones). In some mountain ranges (Gegham Range and southwestern slope of the Karabakh plateau) croplands occupy about 20% (Fig. 10), which is completely inconsistent with reality. In the subalpine zone, croplands occupy more than 10% in total. In the high-altitude zone, in several places, geological formations are classified as buildings.
Comparison of ESRI, ESA, and GLAD datasets shows that in ESRI, the cropland area is significantly larger in mountain-valley semi-desert and dry steppe zones, whereas in GLAD, the cropland area in mountain-valley semi-desert zone is smaller than in the other two datasets (Fig. 4). The ESA dataset is characterized by larger area of tree cover and smaller built-up area, which is particularly noticeable in the semi-deserts, dry steppe, and forest shelter belt. One of the reasons for this is that, as mentioned above, ESA identifies trees within settlements. The presence of trees in submountain semidesert zone in the ESA data is entirely due to this factor – all trees there are located inside settlements. ESRI and GLAD datasets do not show any tree cover in this zone.
Dynamic World 2022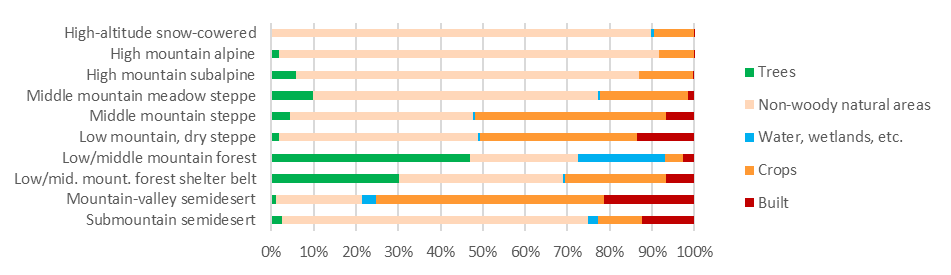
Figure 9. Land cover class shares across landscape zones according tested datasets
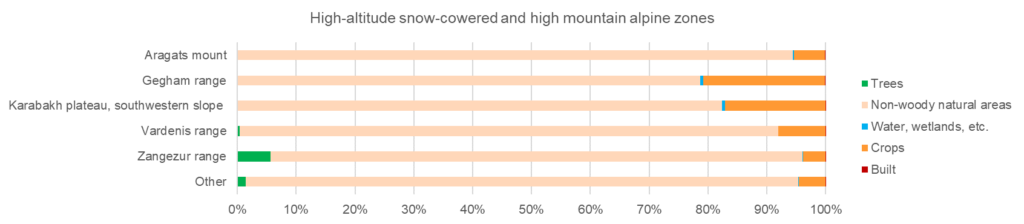
Figure 10. Land cover class shares in high-altitude snow-cowered and high mountain alpine zones across highland systems of Armenia according DW 2022 data