We apologize for possible errors in the machine translation of the site
2.3. Extent of ecosystems (vegetation types)
Creation of updated vegetation map – Alla Aleksanyan (Institute of Botany after A. Takhtajyan NAS RA)
Digitizing of vegetation map – Vardan Asatryan (Scientific center of zoology and hydroecology of NAS RA)
GIS modeling, analysis, and presentation of results – Eduard Kazakov (NextGIS OÜ, Estonia)
Analysis and presentation of results – Elena Bukvareva (BCC-Armenia)
2.3.A. Ecosystem extent at national and marz levels
Vegetation types most accurately reflect the characteristics of terrestrial ecosystems, because vegetation reflects all the main habitat conditions (climate, soil, topography) and forms the trophic basis of ecosystems and largely determines both their functioning and their species diversity. The assessment of the extent of ecosystem types was made based on a vegetation map created by the project experts Alla Aleksanyan and Vardan Asatryan (Fig. 23A-1a). The map was created based on Barseghyan (2007) and other materials.
The current natural area of vegetation zones is defined as the potential area of a given vegetation type minus cropland and built-up areas based on ESRI land cover data 2023 (Fig. 23A-1b). The current distribution of forests is also derived from ESRI land-cover data (Fig. 23A-1c). At this scoping stage, all forests are treated as a single type, regardless of the vegetation zone in which they occur. In the future, when producing a detailed terrestrial ecosystem map, forests should also be classified by type.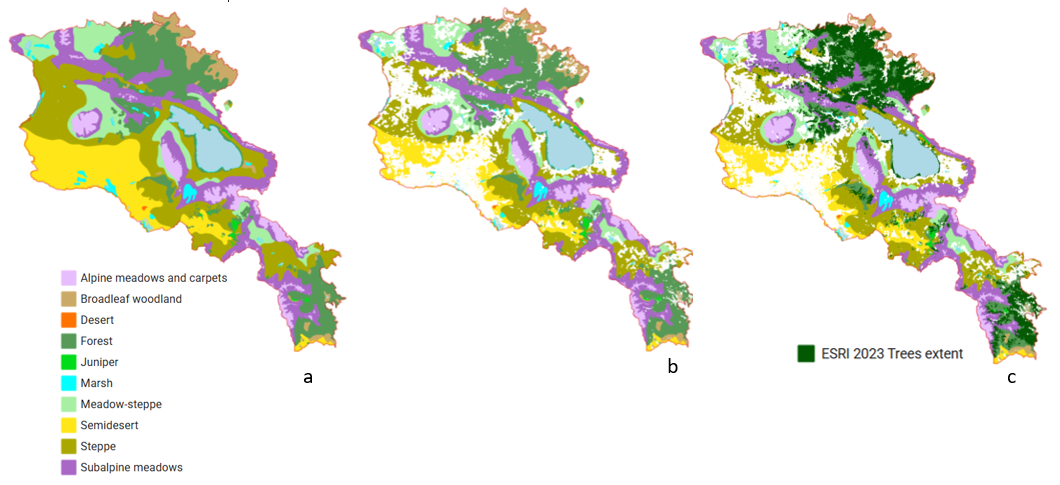
Figure 23A-1. Maps of vegetation: a) potential distribution of vegetation types; b) current natural area of vegetation zones; c) ecosystem types, including current tree cover For detailed map see project Web-GIS, sections Ecosystem Extent/Vegetation/Vegetation map 2025
According to ESRI data, the most human-transformed vegetation zone is semi-desert, where 56% of natural areas remain. It is followed by marshes and steppe with 70% and 76% of natural areas remaining, respectively.Tree cover occupies more than 40% of the forest zone and more than 20% of the broadleaf woodland zone. Significant forest patches are also present in subalpine meadows, meadow-steppe, and steppe zones. In the remaining zones, the tree cover identified by ESRI occupies a very small area — from 0 to 4 km². In the marsh zone, water bodies occupy a substantial area (Lake Sevan is excluded from the analysis) (Table 23A-1; Figure 23A-2).
Table 23A-1. Current area of land cover classes across vegetation zones, km2
| Grass–lands | Tree cover | Bare gr-d | Snow/ Ice | Flood. veg. | Water | Crops | Built-up | Total | Share of natural classes, % | |
| Alpine | 1625.72 | 0.63 | 10.21 | 11.70 | 0.03 | 1.93 | 3.32 | 0.80 | 1654.34 | 99.75 |
| Subalpine | 4287.98 | 256.92 | 5.28 | 0.26 | 0.09 | 2.85 | 85.56 | 25.20 | 4664.14 | 97.63 |
| Meadow-steppe | 2587.14 | 77.83 | 0.22 | 0.04 | 0.76 | 6.66 | 460.94 | 93.06 | 3226.64 | 82.83 |
| Steppe | 5229.35 | 95.86 | 3.24 | 0.00 | 0.03 | 4.89 | 1317.52 | 403.45 | 7054.33 | 75.60 |
| Forest zone | 2892.93 | 2431.91 | 3.91 | 0.00 | 0.60 | 30.37 | 155.70 | 199.61 | 5715.04 | 93.78 |
| Broadleaf woodl. | 695.02 | 269.12 | 2.64 | 0.00 | 0.01 | 7.29 | 125.86 | 83.92 | 1183.86 | 82.28 |
| Juniper | 129.59 | 4.20 | 0.00 | 0.00 | 0.16 | 0.08 | 0.87 | 0.12 | 135.02 | 99.27 |
| Semidesert | 2459.00 | 3.44 | 8.62 | 0.00 | 2.90 | 29.21 | 1212.83 | 716.50 | 4432.49 | 56.47 |
| Desert | 6.64 | 0.00 | 0.21 | 0.00 | 0.00 | 0.00 | 0.52 | 0.28 | 7.65 | 89.58 |
| Marsh | 229.59 | 0.84 | 1.00 | 0.00 | 3.89 | 45.54 | 85.81 | 32.63 | 399.30 | 70.34 |
| Total in Armenia | 20142.95 | 3140.75 | 35.35 | 12.00 | 8.46 | 128.82 | 3448.92 | 1555.56 | 28472.82 | 82.42 |
1. Extent of vegetation zones and current vegetation
According to ESRI data, the most human-transformed vegetation zone is semi-desert, where 57% of natural areas remain. It is followed by marshes and steppe with 71% and 76% of natural areas remaining, respectively. Tree cover occupies more than 40% of the forest zone and more than 20% of the broadleaf woodland zone. Significant forest patches are also present in subalpine meadows, meadow-steppe, and steppe zones. In the remaining zones, the tree cover identified by ESRI occupies a very small area — from 0 to 4 km². In the marsh zone, water bodies occupy a substantial area (Lake Sevan is excluded from the analysis).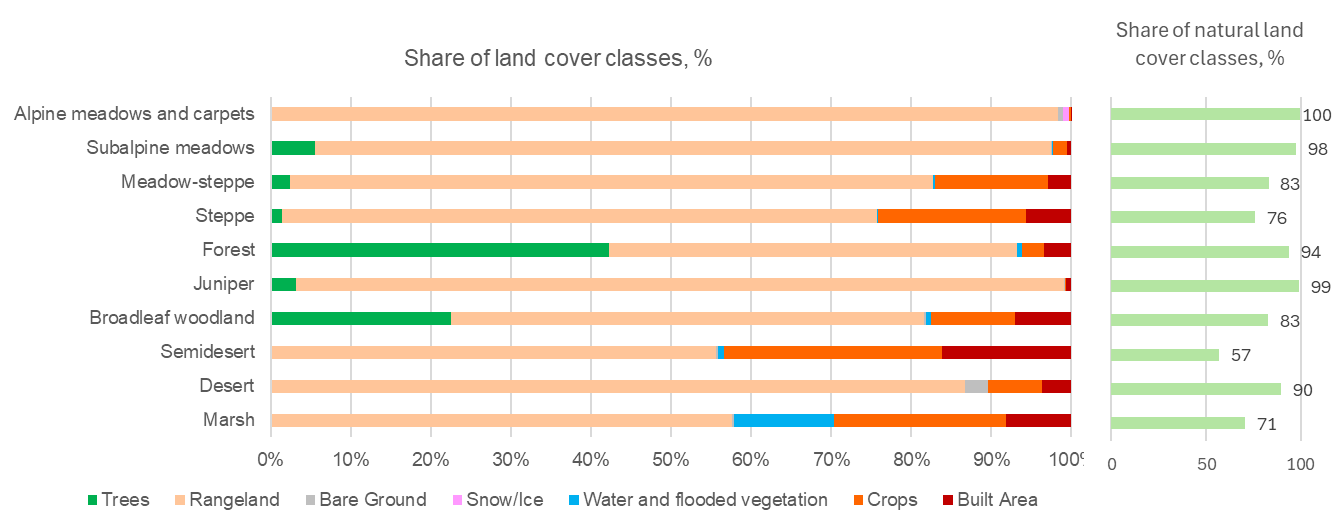 Figure. 4. Share of land cover classes in vegetation zones, %
Table 1. Current area of land cover classes across vegetation zones, km2
| Trees | Range-land | Bare ground | Snow/Ice | Water/ flooded veg. | Crops | Built area | No data/ clouds | Total | Share of natural LC classes,% | |
| Alpine vegeta-tion | 0.61 | 1632.30 | 10.32 | 11.65 | 1.97 | 3.46 | 0.78 | 2.83 | 1663.92 | 100 |
| Sub-alpine mea-dows | 254.58 | 4266.55 | 5.53 | 0.27 | 3.03 | 84.53 | 24.84 | 19.79 | 4659.12 | 98 |
| Meadow-steppe | 76.39 | 2549.78 | 0.22 | 0.04 | 7.25 | 451.65 | 91.45 | 22.66 | 3199.42 | 83 |
| Steppe | 94.59 | 5217.84 | 3.25 | 0.00 | 5.05 | 1302.02 | 399.16 | 27.97 | 7049.88 | 76 |
| Forest | 2397.98 | 2888.01 | 3.92 | 0.00 | 30.51 | 154.96 | 197.66 | 21.76 | 5694.79 | 94 |
| Juniper | 4.23 | 130.60 | 0.12 | 0.00 | 0.09 | 0.17 | 0.89 | 0.05 | 136.15 | 99 |
| Broadleaf wood-land | 263.67 | 691.61 | 2.65 | 0.00 | 7.28 | 123.48 | 82.12 | 27.23 | 1198.03 | 83 |
| Semi-desert | 3.46 | 2462.38 | 9.03 | 0.00 | 33.04 | 1211.12 | 715.19 | 50.39 | 4484.59 | 57 |
| Desert | 0.00 | 6.67 | 0.22 | 0.00 | 0.00 | 0.52 | 0.28 | 0.00 | 7.69 | 90 |
| Marsh | 0.82 | 228.14 | 1.01 | 0.00 | 49.54 | 85.19 | 32.46 | 3.09 | 400.25 | 71 |
| Armenia | 3096.34 | 20073.85 | 36.27 | 11.96 | 137.74 | 3417.09 | 1544.83 | 175.76 | 28493.85 | 83 |
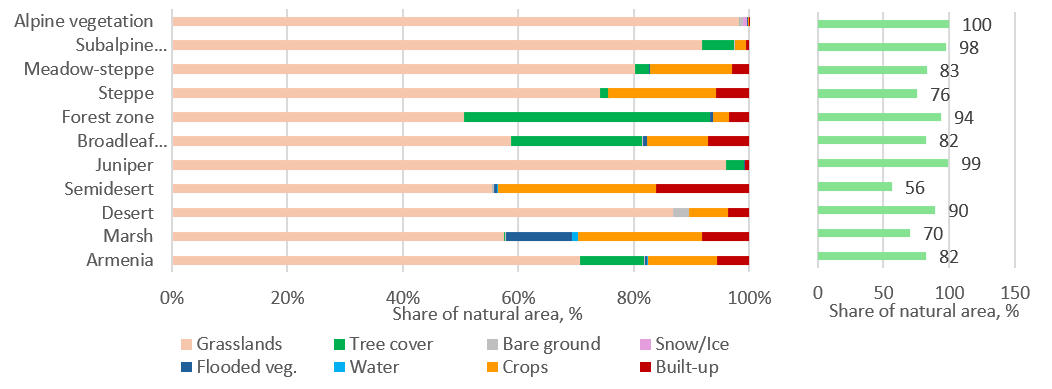
Figure 23A-2. Share of land cover classes across vegetation zones, %
Considering all tree-covered areas as forest, the most widespread natural areas are in steppe and subalpine zones (exceeding 5,000 km² and 4,000 km² respectively), followed by forests and grasslands in forest zone each covering approximately 3,000 km². The smallest zones are marshes and juniper woodlands (270 and 130 km², respectively), as well as the extreme small desert zone, which consists of a single patch covering only 7 km² (Figure 23A-3).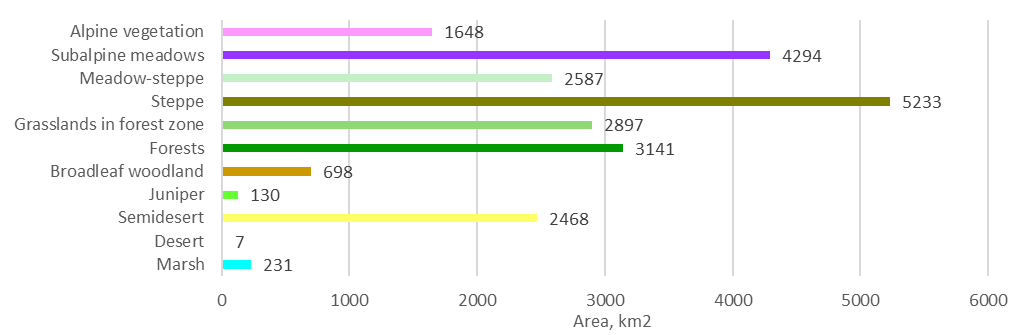 Figure 23A-3. Area of natural ecosystem types, km2
The ecosystem extent (i.e., the area not occupied by croplands or built-up areas) is greatest in Syunik marz and smallest in Armavir marz (Table 23A-2; Figure 23A-4). Forests and grasslands in forest zone occupy the largest areas in the marzes of Lori, Syunik, and Tavush. Alpine and subalpine ecosystems are most extensive in Syunik and Gegharkunik marzes. Steppe and meadow-steppe occupy substantial areas across all marzes except Armavir and Tavush, with the greatest extents in Gegharkunik and Shirak. The largest areas of natural semidesert have been preserved in the marzes of Aragatsotn, Armavir, and Ararat.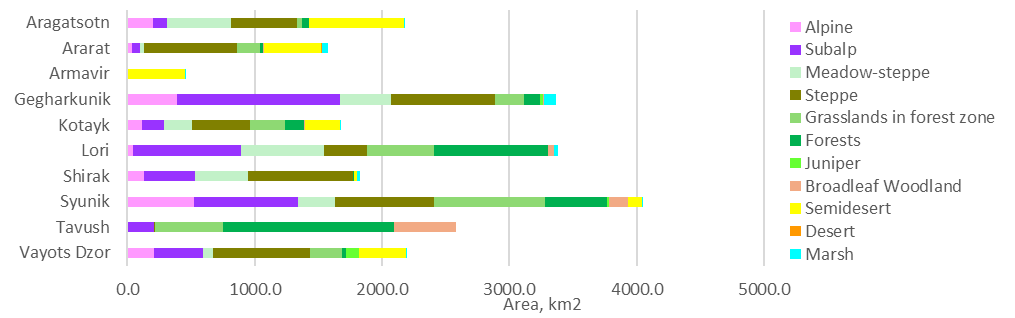 Figure 23A-4. Extent of natural vegetation types across marzes in 2023
Table 23A-2. Extent of natural ecosystems, antropogenic land cover classes, and waterbodies (excluding Sevan Lake) by marzes in 2023
| Water | Crops | Built-up | Alpine | Subalp | Meadow-steppe | Steppe | Grasslands in forest zone | Forests | Juniper | Broadleaf woodland | Semidesert | Desert | Marsh | Total | ||
| Extent in 2023, km2 | Aragatsotn | 3.4 | 443.4 | 140.3 | 204.5 | 107.1 | 502.7 | 517.5 | 42.9 | 48.9 | 0 | 0 | 746.6 | 0 | 5.3 | 2762.6 |
| Ararat | 37.9 | 303.4 | 176.6 | 37.2 | 62.9 | 30.8 | 733.2 | 176.2 | 26.1 | 0 | 9.5 | 444.1 | 6.9 | 49.8 | 2094.6 | |
| Armavir | 6.7 | 609.6 | 183.2 | 0 | 0 | 0 | 0 | 0 | 0.4 | 0 | 0 | 448.8 | 0 | 6.9 | 1255.6 | |
| Gegharkunik | 28.2 | 407.2 | 192.9 | 389.9 | 1280.8 | 400.3 | 817.8 | 227 | 127.9 | 20.8 | 10.6 | 0 | 0 | 92.8 | 3996.2 | |
| Kotayk | 2.6 | 267.5 | 183.8 | 113.9 | 175.9 | 221.7 | 451.6 | 272.6 | 155.1 | 0 | 1.7 | 278.8 | 0 | 8.2 | 2133.4 | |
| Lori | 4.7 | 307.2 | 151.5 | 45 | 847.9 | 649.5 | 337.3 | 526.4 | 899.2 | 0 | 41.8 | 0 | 0 | 31.3 | 3841.8 | |
| Shirak | 30.9 | 758 | 145.5 | 128.3 | 403.9 | 413.5 | 823.9 | 0 | 13.7 | 0 | 0 | 17.3 | 0 | 29 | 2764 | |
| Syunik | 15 | 228.7 | 72 | 524.3 | 813.1 | 291.1 | 781.4 | 871.8 | 487.4 | 12.6 | 145.7 | 110.2 | 0 | 6.5 | 4359.8 | |
| Tavush | 4.4 | 82.1 | 97.7 | 0.3 | 210.9 | 0 | 6.5 | 534 | 1343.7 | 0 | 483.5 | 0 | 0 | 0 | 2763.1 | |
| Vayots Dzor | 2.3 | 32.9 | 44.9 | 210.7 | 385.1 | 77.7 | 763.3 | 246 | 37.9 | 96.3 | 4.6 | 364.7 | 0 | 0.8 | 2267.2 | |
| Total | 136.1 | 3440 | 1388.4 | 1654.1 | 4287.6 | 2587.3 | 5232.5 | 2896.9 | 3140.3 | 129.7 | 697.4 | 2410.5 | 6.9 | 230.6 | 28238.3 |
2.3.B. Ecosystem rarity in Armenia
Currently, desert, juniper, and marsh zones have the smallest natural areas (less than 1% of Armenia’s area). Broadleaf woodlands also are rare (2%) The most widespread are steppe and subalpine meadows (18% and 14%) following by forests (11%). Other types of grasslands account from 6% to 10% of Armenia’s area and can be considered common (Fig. 23B-1, 23B-2).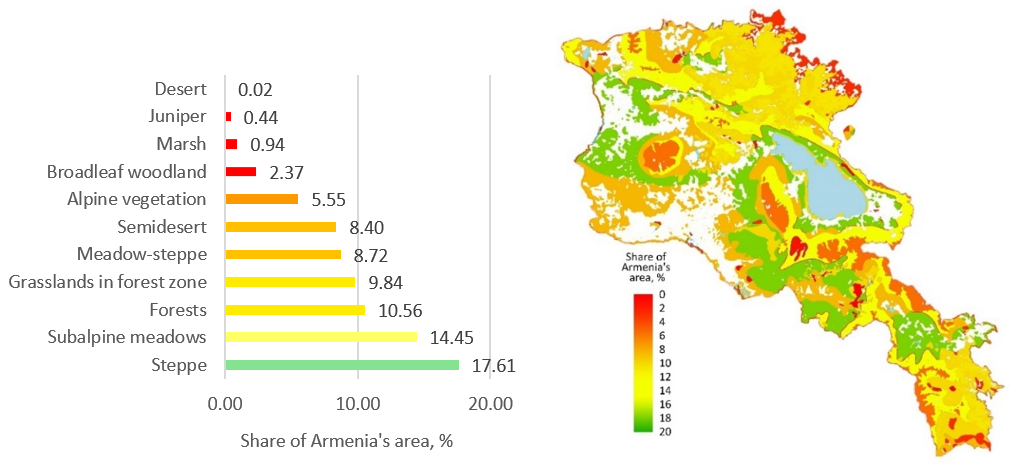
Figure 23B-1. Ranking of ecosystem types by rarity (a) and the map of ecosystem rarity (b)
To assess the importance of marzes for conserving ecosystem diversity in Armenia, we used the indicator of the share of the national area of ecosystem types that is conserved within the marzes and the sum ov these values in marzes (Table 23B-1). This approach was applied to ensure that the value of rare ecosystems is not diminished. According to this criterion, the marz of Ararat is the most important for conserving Armenia’s ecosystem diversity, as it contains the country’s only desert area (100%). The high value of Syunik marz is determined by the fact that it encompasses the full range of ecosystem types. The contribution of Gegharkunik is largely determined by the high proportion of marshes located within it, and the contribution of Vayots Dzor by the high proportion of juniper woodlands (Figure 23B-2).
Table 23B-1. Share of the national area of ecosystem types that is conserved within the marzes, %.
| Alpine vegetation | Subalpine meadows | Meadow-steppe | Steppe | Grasslands in forest zone | Forests | Juniper | Broadleaf woodland | Semidesert | Desert | Marsh | Total | |
| Aragatsotn | 12.36 | 2.50 | 19.43 | 9.89 | 1.48 | 1.56 | 0.00 | 0.00 | 30.97 | 0.00 | 2.30 | 80.49 |
| Ararat | 2.25 | 1.47 | 1.19 | 14.01 | 6.08 | 0.83 | 0.00 | 1.36 | 18.42 | 100.00 | 21.60 | 167.21 |
| Armavir | 0.00 | 0.00 | 0.00 | 0.00 | 0.00 | 0.01 | 0.00 | 0.00 | 18.62 | 0.00 | 2.99 | 21.62 |
| Gegharkunik | 23.57 | 29.87 | 15.47 | 15.63 | 7.84 | 4.07 | 16.04 | 1.52 | 0.00 | 0.00 | 40.24 | 154.25 |
| Kotayk | 6.89 | 4.10 | 8.57 | 8.63 | 9.41 | 4.94 | 0.00 | 0.24 | 11.57 | 0.00 | 3.56 | 57.90 |
| Lori | 2.72 | 19.78 | 25.10 | 6.45 | 18.17 | 28.63 | 0.00 | 5.99 | 0.00 | 0.00 | 13.57 | 120.42 |
| Shirak | 7.76 | 9.42 | 15.98 | 15.75 | 0.00 | 0.44 | 0.00 | 0.00 | 0.72 | 0.00 | 12.58 | 62.63 |
| Syunik | 31.70 | 18.96 | 11.25 | 14.93 | 30.09 | 15.52 | 9.71 | 20.89 | 4.57 | 0.00 | 2.82 | 160.46 |
| Tavush | 0.02 | 4.92 | 0.00 | 0.12 | 18.43 | 42.79 | 0.00 | 69.33 | 0.00 | 0.00 | 0.00 | 135.61 |
| Vayots Dzor | 12.74 | 8.98 | 3.00 | 14.59 | 8.49 | 1.21 | 74.25 | 0.66 | 15.13 | 0.00 | 0.35 | 139.39 |
| Total | 100.00 | 100.00 | 100.00 | 100.00 | 100.00 | 100.00 | 100.00 | 100.00 | 100.00 | 100.00 | 100.00 |
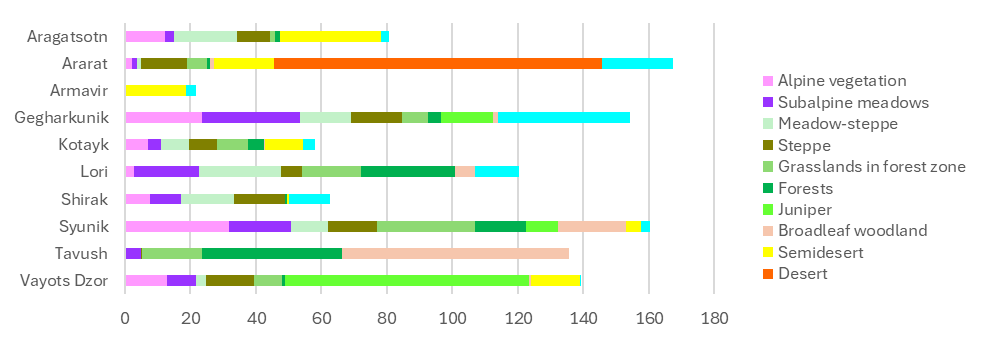
Figure 23B-2.The sum of the shares (%%) of the national area of ecosystem types that are conserved within the marzes.
2.3.C. Changes in ecosystem extent from 2017 to 2023
The vegetation-type transition matrix shows how areas of vegetation zones transited into land-cover classes (e.g., steppe vegetation converting to croplands, built-up, bare ground, or tree cover, and vice versa). Zone-to-zone vegetation transitions are not recorded in PV1, because the zone boundaries did not change. Table 23C-1 presents aggregated data: bare ground and snow/ice are added to the natural area of the corresponding vegetation zone, and the areas of water and flooded vegetation are combined (for full matrix see Appendix 3). Data on transitions from the natural areas of vegetation zones to anthropogenic territories and to tree cover—and back—allow us to populate rows “Additions to extent” and “Reductions in extent” in the accounting table (Table 23C-2).
Table 23C-1. Aggregated vegetation type transition matrix from 2017 to 2023, km2
| Alpine vege-tation | Subalpine meadows | Meadow-steppe | Steppe | Grassl. in forest zone | Juniper | Broadleaf woodland | Semi-desert | Desert | Marsh | Forests | Water and flood. veg. | Crops | Built-up | Total area in 2017 | Reduc-tion | |
| Alpine veg. | 1642.9 | 0.0 | 0.0 | 0.0 | 0.0 | 0.0 | 0.0 | 0.0 | 0.0 | 0.0 | 0.4 | 0.2 | 2.3 | 0.1 | 1645.9 | 3.0 |
| Subalpine meadows | 0.0 | 4216.6 | 0.0 | 0.0 | 0.0 | 0.0 | 0.0 | 0.0 | 0.0 | 0.0 | 19.6 | 0.5 | 60.9 | 2.9 | 4300.5 | 83.8 |
| Meadow-steppe | 0.0 | 0.0 | 2552.1 | 0.0 | 0.0 | 0.0 | 0.0 | 0.0 | 0.0 | 0.0 | 10.9 | 2.3 | 270.0 | 6.2 | 2841.5 | 289.4 |
| Steppe | 0.0 | 0.0 | 0.0 | 5039.5 | 0.0 | 0.0 | 0.0 | 0.0 | 0.0 | 0.0 | 11.3 | 1.0 | 370.2 | 21.3 | 5443.2 | 403.8 |
| Grassl. in forest zone | 0.0 | 0.0 | 0.0 | 0.0 | 2628.1 | 0.0 | 0.0 | 0.0 | 0.0 | 0.0 | 143.6 | 1.4 | 54.9 | 22.2 | 2850.2 | 222.1 |
| Juniper | 0.0 | 0.0 | 0.0 | 0.0 | 0.0 | 127.5 | 0.0 | 0.0 | 0.0 | 0.0 | 0.9 | 0.0 | 0.2 | 0.2 | 128.8 | 1.2 |
| Broadleaf woodland | 0.0 | 0.0 | 0.0 | 0.0 | 0.0 | 0.0 | 640.4 | 0.0 | 0.0 | 0.0 | 36.2 | 2.5 | 24.9 | 6.6 | 710.6 | 70.2 |
| Semi-desert | 0.0 | 0.0 | 0.0 | 0.0 | 0.0 | 0.0 | 0.0 | 2274.9 | 0.0 | 0.0 | 1.1 | 4.4 | 142.5 | 55.8 | 2478.5 | 203.6 |
| Desert | 0.0 | 0.0 | 0.0 | 0.0 | 0.0 | 0.0 | 0.0 | 0.0 | 6.8 | 0.0 | 0.0 | 0.0 | 0.0 | 0.3 | 7.1 | 0.3 |
| Marsh | 0.0 | 0.0 | 0.0 | 0.0 | 0.0 | 0.0 | 0.0 | 0.0 | 0.0 | 212.5 | 0.2 | 5.1 | 17.1 | 1.9 | 236.8 | 24.3 |
| Forests | 3.2 | 62.5 | 11.4 | 22.7 | 238.5 | 2.0 | 18.8 | 3.3 | 0.0 | 0.4 | 2909.9 | 0.6 | 3.7 | 2.7 | 3279.8 | 369.9 |
| Water/flooded veg. | 0.2 | 0.4 | 1.2 | 0.8 | 1.8 | 0.0 | 0.6 | 4.2 | 0.0 | 5.3 | 0.5 | 110.9 | 9.2 | 2.4 | 137.5 | 26.6 |
| Crops | 1.3 | 12.6 | 20.3 | 162.8 | 21.8 | 0.0 | 35.5 | 179.1 | 0.1 | 11.5 | 3.0 | 7.8 | 2478.5 | 97.2 | 3031.7 | 553.2 |
| Built-up | 0.1 | 1.4 | 2.4 | 6.8 | 6.6 | 0.2 | 2.3 | 6.0 | 0.0 | 0.8 | 3.3 | 0.5 | 13.7 | 1336.6 | 1380.7 | 44.1 |
| Total area in 2023 | 1647.6 | 4293.5 | 2587.4 | 5232.6 | 2896.8 | 129.7 | 697.7 | 2467.6 | 6.9 | 230.6 | 3140.7 | 137.1 | 3448.2 | 1556.3 | 28472.8 | 2295.46 |
| Expansion | 4.8 | 76.9 | 35.3 | 193.1 | 268.8 | 2.2 | 57.2 | 192.7 | 0.1 | 18.0 | 230.9 | 26.2 | 969.7 | 219.7 | 2295.5 |
Table 2.3.С-2. Accounting table of vegetation type extent for 2017 and 2023, km2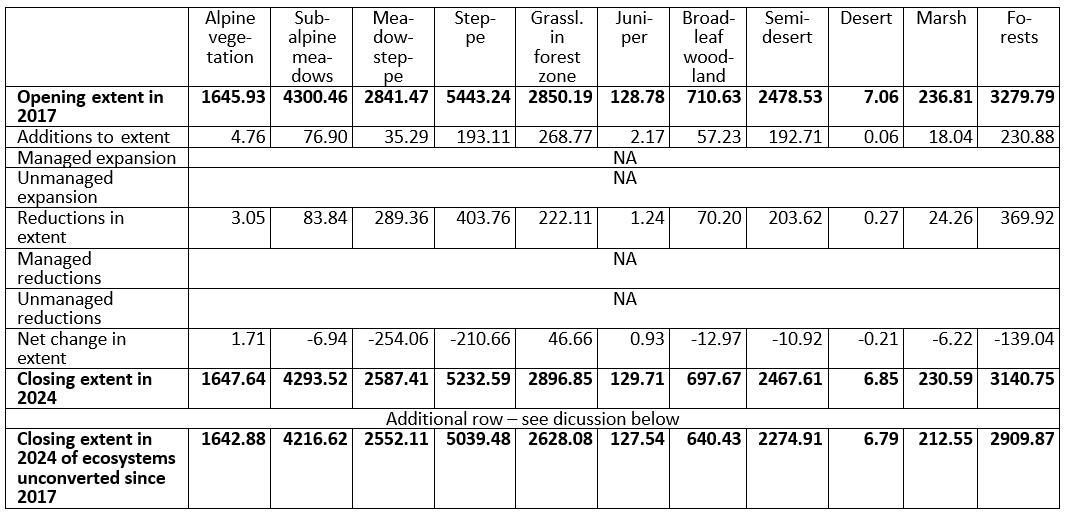
The largest transformation areas are represented by transitions of various grassland types into croplands: 370 km² of steppes, 270 km² of meadow-steppes, 144 km² of semideserts, and 61 km² of subalpine meadows were converted into croplands. The total increase in cropland area amounted to 970 km² (Table 23C-1; Figure 23C-1). The reverse process—conversion of croplands back into grasslands—was weaker and could not compensate for their loss. The exceptions are semideserts and woodlands, where the reverse transition from croplands exceeded new agricultural expansion. Based on the formal ratio of areas over the six-year period, the intensity of agricultural development in these zones has decreased. The opposite trend is observed in meadow-steppes and alpine meadows, where reverse transitions are extremely small, indicating an increase in agricultural expansion intensity (Figure 23C-2).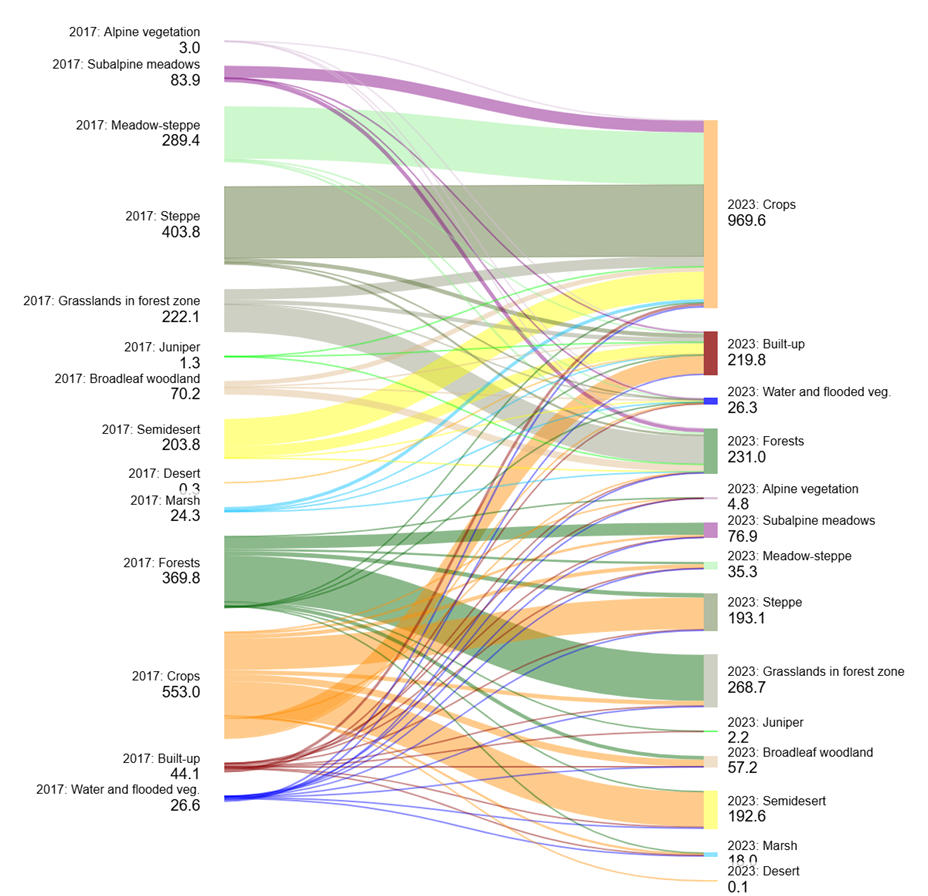 Figure 23C-1. Transitions between vegetation zones and land cover classes. Self-transitions (categories remaining the same) are not shown. The total losses and gains in the diagram differ slightly from Table 23С-1 because they were computed by SankeyMATIC using a different rounding approach for totals.
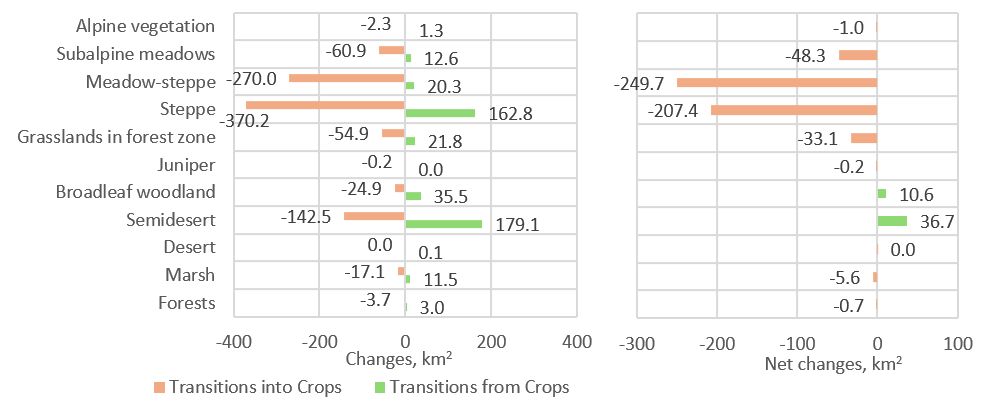 Figure 23C-2. Transitions between vegetation zones and croplands
Considering not only the net extent changes but also the transitions between natural ecosystems and anthropogenic areas and vice versa is crucial for conserving biodiversity and maintaining ecosystems’ full capacity to provide ES. It is evident that any new additions to ecosystem area resulting from transitions out of croplands or built-up areas are merely nominal increases in area. In our case study, over six years the areas freed from cultivation and development did not recover into functioning ecosystems. In reality, these are abandoned fields or wastelands that, in terms of biodiversity and ecosystem functioning, are far from natural ecosystems. Thus, the closing extent for ecosystems that were not transformed during the reporting period equals the opening extent minus the reductions during the reporting period (Table 23C-2). To set up accounting of unchanged natural ecosystems, it is advisable to designate areas converted from croplands and built-up areas as “abandoned fields and sites” within each vegetation zone. Under such accounting, their re-use will not reduce the reported extent of unchanged ecosystems.
Totally, from 2017 to 2023, the area of the most vegetation types not occupied by croplands and built-up areas decreased. The exceptions are grasslands in forest zone, juniper woodlands and alpine vegetation (Figure 23C-3). The most significant reductions, both in absolute and relative terms, occurred in the meadow-steppe (254 km2, 8.9% relative to area in 2017). Steppes and forests declined by roughly 4% (211 km² and 139 km², respectively). Reductions in other vegetation types are small in absolute terms—only a few square kilometres, and for desert just 0.2 km².
However, for conserving ecosystem diversity, not only absolute but also relative changes in area matter, especially for ecosystem types with a small total extent. Thus, the very small absolute changes in the area of marshes and desert correspond to relative declines of 2.6% and 3%, respectively—comparable to the reductions in steppe and forest. In other words, for the purpose of conserving ecosystem diversity, they are no less important than the 100–200 km² losses observed for steppe and forest.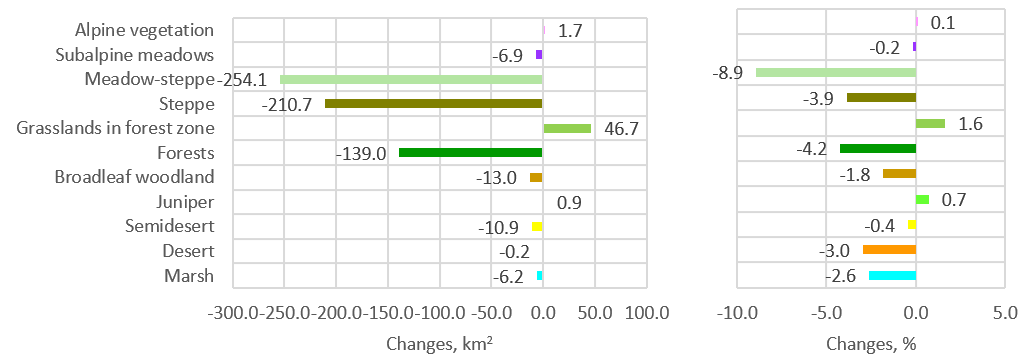 Figure 23C-3. Net changes in area of vegetation types from 2017 to 2023
Changes in the natural vegetation types from 2017 to 2023 are small in absolute terms—on the order of tens of square kilometers or less. The most noticeable absolute losses of natural vegetation occurred in the steppe and meadow-steppe zones, especially in the provinces of Shirak, Gegharkunik, and Lori, as well in forests in the mars Syunik (Fig. 23C-4a; Table 23C-3). However, in relative terms (the share of area lost or gained relative to 2017, %), the largest loss of tree cover is in Armavir marz with very small total tree cover area. Changes in the area of marshes and broadleaf woodlands also become noticeable, whereas they are almost imperceptible in absolute terms (Fig. 23C-4b; Table 23C-3).
Table 23C-3. Extent of natural vegetation types, antropogenic land cover classes, and water (excuding Sevan Lake) by marzes in 2017 and in 2023 and changes in it
| Water | Crops | Built-up | Alpine | Subalp | Meadow-steppe | Steppe | Grasslands in forest zone | Forests | Juniper | Broadleaf woodland | Semidesert | Desert | Marsh | Total | ||
| Extent in 2017, km2 | Aragatsotn | 3.5 | 384 | 127.3 | 204.3 | 108.2 | 564.4 | 510.5 | 42.4 | 53.2 | 0 | 0 | 759.2 | 0 | 5.8 | 2762.8 |
| Ararat | 39.8 | 356.1 | 144.3 | 37.2 | 62.6 | 30.8 | 730.7 | 174.7 | 30.4 | 0 | 9.5 | 425.1 | 7.1 | 46.2 | 2094.5 | |
| Armavir | 7.9 | 645.2 | 146.5 | 0 | 0 | 0 | 0 | 0 | 2.5 | 0 | 0 | 448 | 0 | 5.6 | 1255.7 | |
| Gegharkunik | 28.9 | 316.6 | 182.4 | 389.3 | 1292.6 | 420.5 | 878 | 230.9 | 133.6 | 20.7 | 8.8 | 0 | 0 | 93.9 | 3996.2 | |
| Kotayk | 2.5 | 272.6 | 156.2 | 113.3 | 168.8 | 219.2 | 456.8 | 271.1 | 174 | 0 | 1.7 | 288.6 | 0 | 8.6 | 2133.4 | |
| Lori | 3.2 | 194.2 | 141.7 | 43.9 | 851.1 | 701.1 | 385.1 | 554.3 | 885.4 | 0 | 50.2 | 0 | 0 | 31.7 | 3841.9 | |
| Shirak | 27.2 | 547.7 | 140.2 | 127.9 | 427.1 | 512 | 910.9 | 0 | 13.4 | 0 | 0 | 17.4 | 0 | 40.2 | 2764 | |
| Syunik | 19.4 | 165.8 | 64.7 | 518.9 | 793.8 | 315.7 | 801.9 | 799.9 | 608.7 | 11.9 | 140.6 | 110.6 | 0 | 7.9 | 4359.8 | |
| Tavush | 4 | 91.6 | 93.1 | 0.3 | 205.2 | 0 | 5.9 | 536.6 | 1331.5 | 0 | 494.9 | 0 | 0 | 0 | 2763.1 | |
| Vayots Dzor | 2.8 | 34.9 | 39.3 | 210.7 | 385.2 | 77.7 | 763.4 | 240.2 | 46.8 | 96.2 | 4.7 | 364.6 | 0 | 0.7 | 2267.2 | |
| Total | 139.2 | 3008.7 | 1235.7 | 1645.8 | 4294.6 | 2841.4 | 5443.2 | 2850.1 | 3279.5 | 128.8 | 710.4 | 2413.5 | 7.1 | 240.6 | 28238.6 | |
| Extent in 2023, km2 | Aragatsotn | 3.4 | 443.4 | 140.3 | 204.5 | 107.1 | 502.7 | 517.5 | 42.9 | 48.9 | 0 | 0 | 746.6 | 0 | 5.3 | 2762.6 |
| Ararat | 37.9 | 303.4 | 176.6 | 37.2 | 62.9 | 30.8 | 733.2 | 176.2 | 26.1 | 0 | 9.5 | 444.1 | 6.9 | 49.8 | 2094.6 | |
| Armavir | 6.7 | 609.6 | 183.2 | 0 | 0 | 0 | 0 | 0 | 0.4 | 0 | 0 | 448.8 | 0 | 6.9 | 1255.6 | |
| Gegharkunik | 28.2 | 407.2 | 192.9 | 389.9 | 1280.8 | 400.3 | 817.8 | 227 | 127.9 | 20.8 | 10.6 | 0 | 0 | 92.8 | 3996.2 | |
| Kotayk | 2.6 | 267.5 | 183.8 | 113.9 | 175.9 | 221.7 | 451.6 | 272.6 | 155.1 | 0 | 1.7 | 278.8 | 0 | 8.2 | 2133.4 | |
| Lori | 4.7 | 307.2 | 151.5 | 45 | 847.9 | 649.5 | 337.3 | 526.4 | 899.2 | 0 | 41.8 | 0 | 0 | 31.3 | 3841.8 | |
| Shirak | 30.9 | 758 | 145.5 | 128.3 | 403.9 | 413.5 | 823.9 | 0 | 13.7 | 0 | 0 | 17.3 | 0 | 29 | 2764 | |
| Syunik | 15 | 228.7 | 72 | 524.3 | 813.1 | 291.1 | 781.4 | 871.8 | 487.4 | 12.6 | 145.7 | 110.2 | 0 | 6.5 | 4359.8 | |
| Tavush | 4.4 | 82.1 | 97.7 | 0.3 | 210.9 | 0 | 6.5 | 534 | 1343.7 | 0 | 483.5 | 0 | 0 | 0 | 2763.1 | |
| Vayots Dzor | 2.3 | 32.9 | 44.9 | 210.7 | 385.1 | 77.7 | 763.3 | 246 | 37.9 | 96.3 | 4.6 | 364.7 | 0 | 0.8 | 2267.2 | |
| Total | 136.1 | 3440 | 1388.4 | 1654.1 | 4287.6 | 2587.3 | 5232.5 | 2896.9 | 3140.3 | 129.7 | 697.4 | 2410.5 | 6.9 | 230.6 | 28238.3 | |
| Change, km2 | Aragatsotn | 0 | 59.4 | 13 | 0.1 | -1.1 | -61.7 | 7.1 | 0.4 | -4.2 | 0 | 0 | -12.6 | 0 | -0.5 | |
| Ararat | -1.9 | -52.8 | 32.4 | -0.1 | 0.3 | 0 | 2.5 | 1.4 | -4.3 | 0 | 0 | 19 | -0.2 | 3.7 | ||
| Armavir | -1.2 | -35.6 | 36.7 | 0 | 0 | 0 | 0 | 0 | -2.1 | 0 | 0 | 0.9 | 0 | 1.3 | ||
| Gegharkunik | -0.7 | 90.6 | 10.5 | 0.6 | -11.8 | -20.2 | -60.2 | -3.9 | -5.7 | 0 | 1.8 | 0 | 0 | -1.1 | ||
| Kotayk | 0.1 | -5.1 | 27.6 | 0.6 | 7.1 | 2.5 | -5.3 | 1.5 | -18.9 | 0 | 0 | -9.7 | 0 | -0.4 | ||
| Lori | 1.5 | 113 | 9.8 | 1.1 | -3.1 | -51.6 | -47.8 | -27.9 | 13.8 | 0 | -8.4 | 0 | 0 | -0.4 | ||
| Shirak | 3.7 | 210.3 | 5.2 | 0.4 | -23.2 | -98.5 | -86.9 | 0 | 0.3 | 0 | 0 | -0.1 | 0 | -11.2 | ||
| Syunik | -4.4 | 62.8 | 7.3 | 5.4 | 19.3 | -24.6 | -20.5 | 71.9 | -121.3 | 0.7 | 5.1 | -0.4 | 0 | -1.4 | ||
| Tavush | 0.4 | -9.4 | 4.6 | 0 | 5.6 | 0 | 0.6 | -2.6 | 12.2 | 0 | -11.4 | 0 | 0 | 0 | ||
| Vayots Dzor | -0.4 | -1.9 | 5.6 | 0 | -0.1 | 0 | -0.1 | 5.7 | -8.9 | 0.2 | -0.1 | 0 | 0 | 0 | ||
| Total | -2.9 | 431.3 | 152.7 | 8.1 | -7 | -254.1 | -210.6 | 46.5 | -139.1 | 0.9 | -13 | -2.9 | -0.2 | -10 | ||
| Change, relative to 2017, % | Aragatsotn | -0.2 | 15.5 | 10.2 | 0.1 | -1 | -10.9 | 1.4 | 1 | -8 | 0 | 0 | -1.7 | 0 | -8.7 | |
| Ararat | -4.9 | -14.8 | 22.4 | -0.2 | 0.5 | 0.1 | 0.3 | 0.8 | -14.1 | 0 | 0 | 4.5 | -3 | 7.9 | ||
| Armavir | -14.9 | -5.5 | 25 | 0 | 0 | 0 | 0 | 0 | -83.5 | 0 | 0 | 0.2 | 0 | 23.1 | ||
| Gegharkunik | -2.3 | 28.6 | 5.7 | 0.2 | -0.9 | -4.8 | -6.9 | -1.7 | -4.2 | 0.1 | 20.5 | 0 | 0 | -1.2 | ||
| Kotayk | 3.2 | -1.9 | 17.7 | 0.6 | 4.2 | 1.2 | -1.2 | 0.6 | -10.9 | 0 | 0.1 | -3.4 | 0 | -4.6 | ||
| Lori | 48.3 | 58.2 | 6.9 | 2.5 | -0.4 | -7.4 | -12.4 | -5 | 1.6 | 0 | -16.7 | 0 | 0 | -1.1 | ||
| Shirak | 13.7 | 38.4 | 3.7 | 0.3 | -5.4 | -19.2 | -9.5 | 0 | 2.3 | 0 | 0 | -0.5 | 0 | -27.9 | ||
| Syunik | -22.8 | 37.9 | 11.2 | 1 | 2.4 | -7.8 | -2.6 | 9 | -19.9 | 6.2 | 3.7 | -0.4 | 0 | -17.3 | ||
| Tavush | 9.3 | -10.3 | 5 | 0 | 2.7 | 0 | 10.3 | -0.5 | 0.9 | 0 | -2.3 | 0 | 0 | 0 | ||
| Vayots Dzor | -14.9 | -5.5 | 14.2 | 0 | 0 | 0 | 0 | 2.4 | -19 | 0.2 | -2.1 | 0 | 0 | 0.6 |
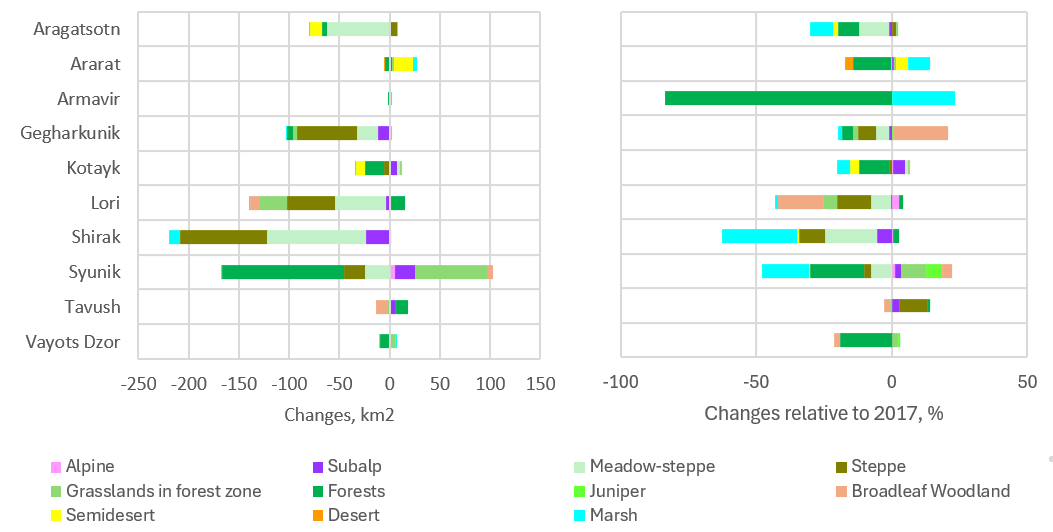 Figure 23C-4. Changes in natural area of vegetation types by provinces from 2017 to 2023: a) absolute changes, km2; b) chare of lost/gained area, % relative to 2017.
2.3.D. Reduction of the potential area of vegetation types identified on the 1961 vegetation map
For this analysis, the vegetation map from the 1961 Atlas of the Armenian SSR* (digitized by Vardan Asatryan) and the ESRI land cover 2023 data were used. The current zones of vegetation types was considered as potential vegetation zones, excluding croplands and built-up areas based on ESRI data for 2023.
This analysis considers only zones of possible distribution of the vegetation types mapped in 1961. The actual presence of vegetation requires verification through field surveys.
Vegetation map 1961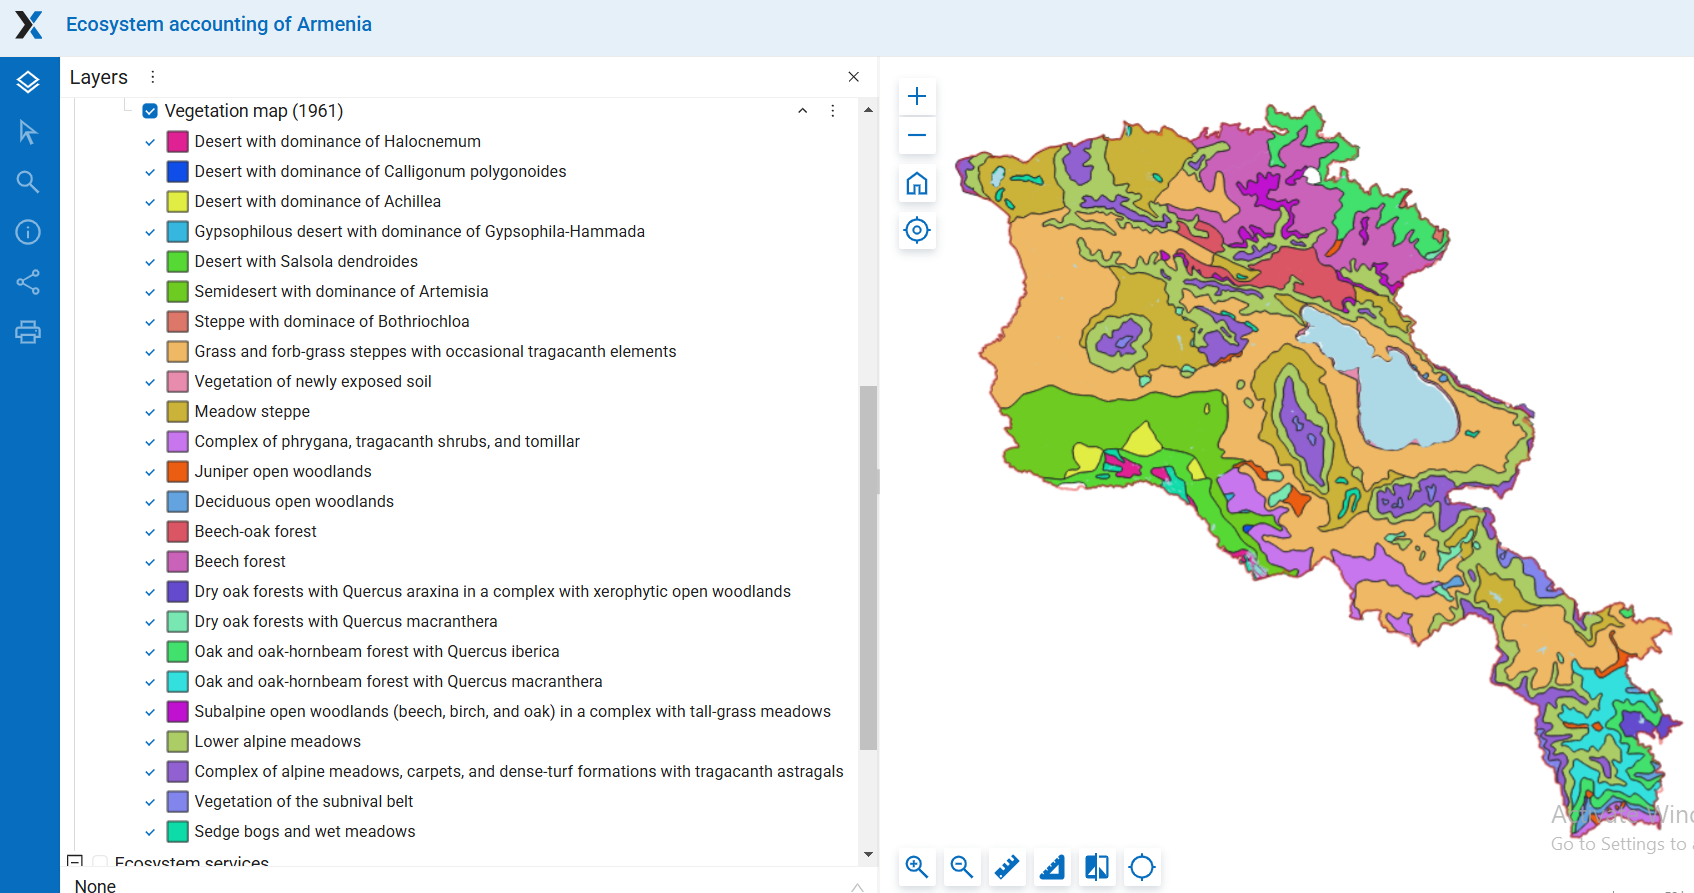
Vegetation map excluding crops and built-up areas from ESRI 2023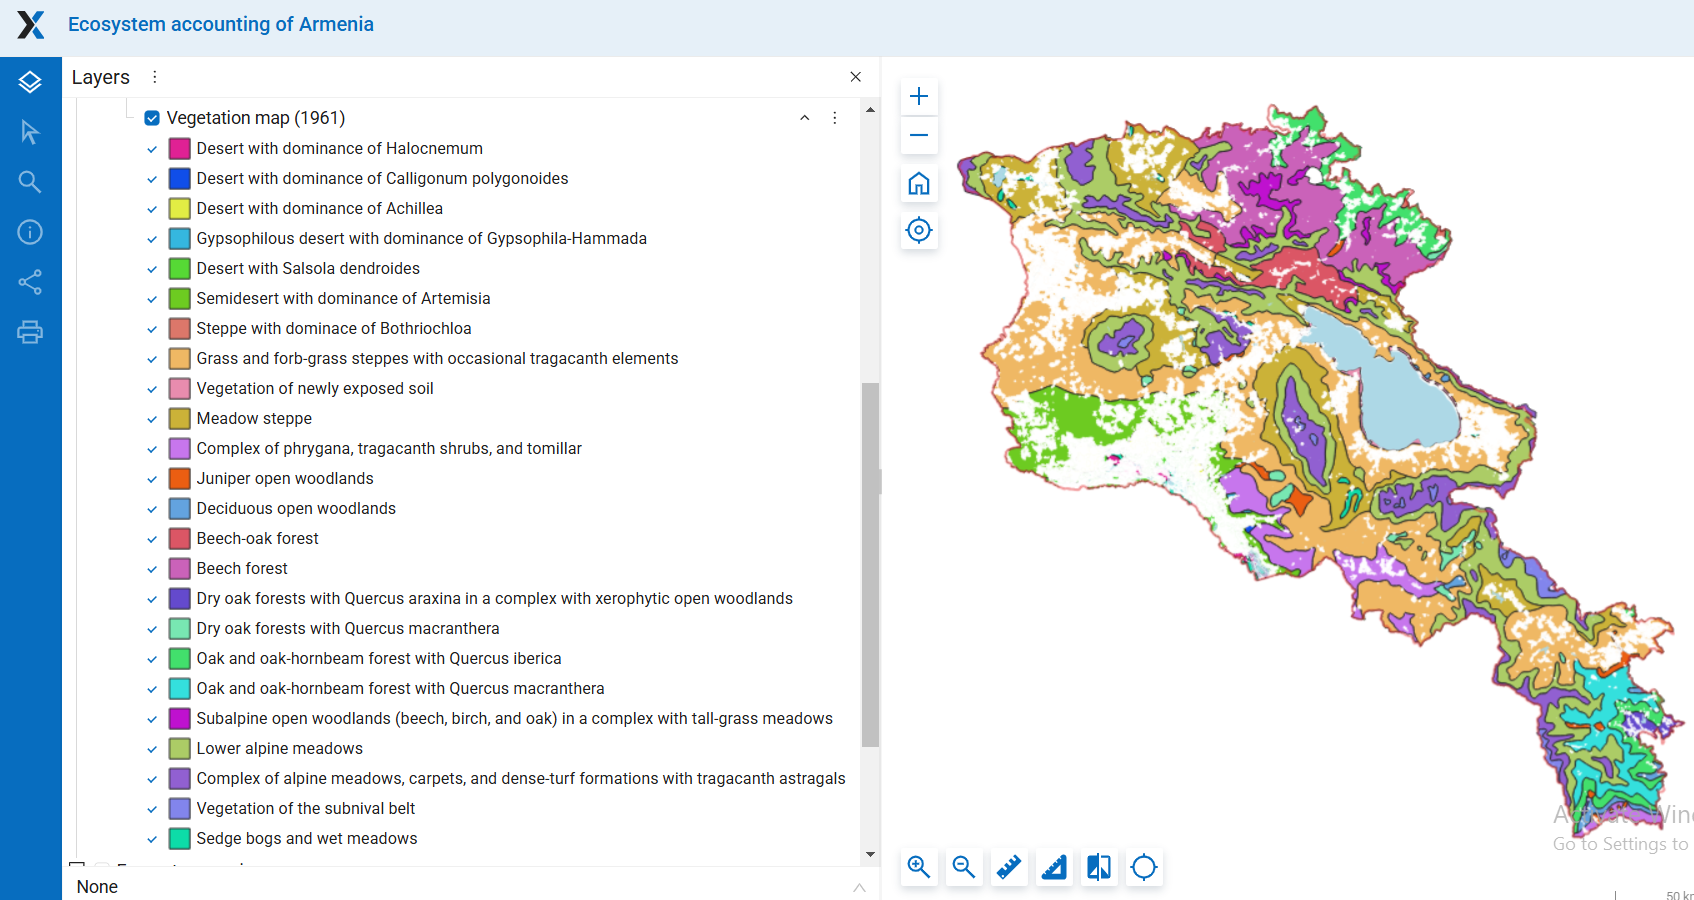
For detailed maps see in the Section Ecosystem Extent/Vegetation
Ranking of vegetation types by their current rarity shows that, at present, all desert types (1–5) as well as steppe with dominance of Bothriochloa (type 7) are the rarest. Each of them occupies less than 100 km². The potential distribution areas of the two rarest desert types (2 and 4), each occupying less than 10 km², have largely preserved and mostly not covered by croplands or built-up areas according to ESRI data. The distribution area of steppe with dominance of Bothriochloa (7) also appears to be relatively well preserved.
The most severely affected was the distribution area of desert with dominance of Achillea (3), of which only 7% remains, as well as desert with Salsola dendroides (5), with only 16% remaining. The distribution area of desert with dominance of Halocnemum (1) has also been significantly reduced, with 43% remaining. These three vegetation types have experienced the greatest decline among all types shown on the map.
Relatively rare vegetation types occupying between 100 and 200 km² — deciduous and juniper open woodland (12, 13) and variants of oak forests (16, 17) — have relatively well-preserved distribution areas, with 85–99% remaining.
Among the more widespread vegetation types, occupying between 200 and 1,000 km², a significant reduction was observed only for sedge bogs and wet meadows (type 24), which declined to 63%. The distribution areas of other types — subnival vegetation, subalpine open woodlands, variants of oak and birch-oak forests, as well as shrublands — have been largely unaffected by human activity, with 94–100% of their area remaining intact.
Among the common and widespread vegetation types occupying more than 1,000 km², significant reductions have occurred in semi-desert with dominance of Artemisia (type 6) with 57% remaining and the most widespread vegetation zone – grass and forb-grass steppes (type 8) with 75% remaining, both of which are located in areas of arable agriculture.
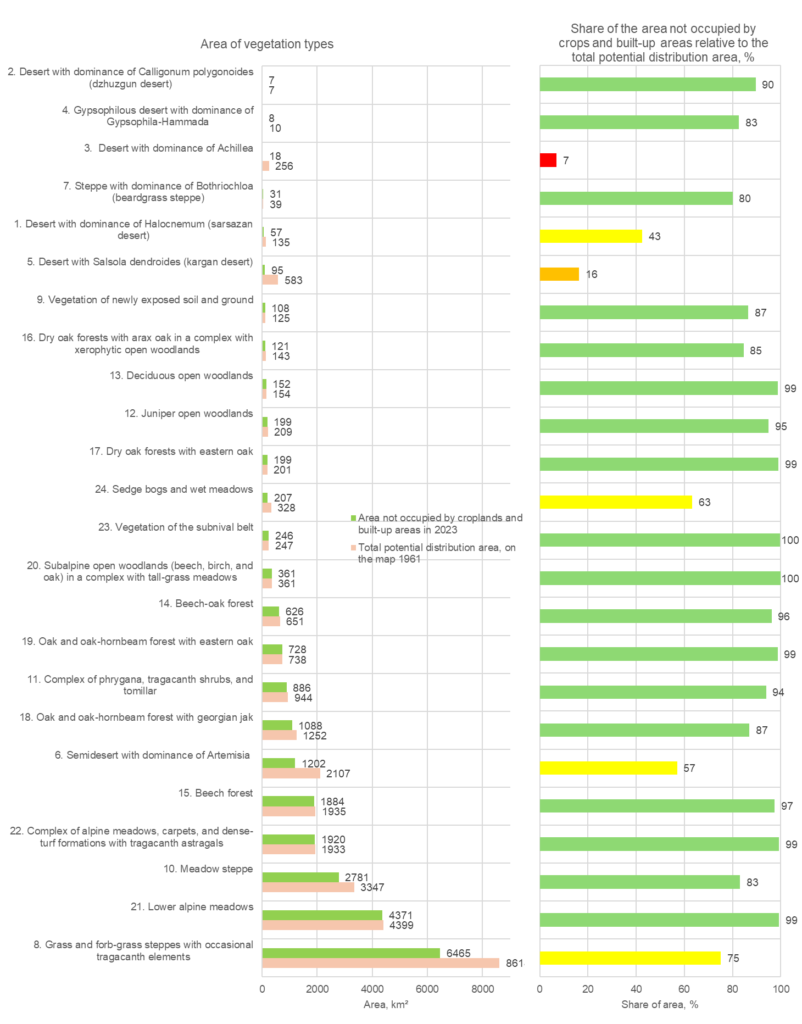
Figure 23D-2. Potential area of vegetation types and their current state: a) potential area of each vegetation type and the area remaining as of 2023; vegetation types are ranked by their rarity in 2023; b) share of the area not occupied by croplands and built-up areas relative to the total potential distribution area, %.
Table 23D-1. Potential and current areas of vegetation types and the degree of their preservation
| Total potential distribution area on the map 1961, km2 | Area not occupied by croplands and built-up areas in 2023, km2 | Share of the area not occupied by croplands and built-up areas relative to the total potential distribution area, % | |
| 1. Desert with dominance of Halocnemum (sarsazan desert) | 135.1 | 57.5 | 42.5 |
| 2. Desert with dominance of Calligonum polygonoides (dzhuzgun desert) | 7.4 | 6.6 | 89.6 |
| 3. Desert with dominance of Achillea | 256.0 | 17.6 | 6.9 |
| 4. Gypsophilous desert with dominance of Gypsophila-Hammada | 9.8 | 8.1 | 82.6 |
| 5. Desert with Salsola dendroides (kargan desert) | 582.7 | 95.3 | 16.4 |
| 6. Semidesert with dominance of Artemisia | 2107.2 | 1201.5 | 57.0 |
| 7. Steppe with dominance of Bothriochloa (beardgrass steppe) | 39.1 | 31.3 | 80.0 |
| 8. Grass and forb-grass steppes with occasional tragacanth elements | 8614.1 | 6464.9 | 75.1 |
| 9. Vegetation of newly exposed soil and ground | 124.5 | 107.8 | 86.6 |
| 10. Meadow steppe | 3347.4 | 2781.2 | 83.1 |
| 11. Complex of phrygana, tragacanth shrubs, and tomillar | 944.1 | 886.5 | 93.9 |
| 12. Juniper open woodlands | 209.5 | 198.9 | 94.9 |
| 13. Deciduous open woodlands | 153.5 | 151.6 | 98.8 |
| 14. Beech-oak forest | 650.5 | 625.7 | 96.2 |
| 15. Beech forest | 1934.6 | 1884.0 | 97.4 |
| 16. Dry oak forests with arax oak in a complex with xerophytic open woodlands | 143.1 | 121.1 | 84.6 |
| 17. Dry oak forests with eastern oak | 200.9 | 199.1 | 99.1 |
| 18. Oak and oak-hornbeam forest with georgian jak | 1252.1 | 1088.1 | 86.9 |
| 19. Oak and oak-hornbeam forest with eastern oak | 737.8 | 728.2 | 98.7 |
| 20. Subalpine open woodlands (beech, birch, and oak) in a complex with tall-grass meadows | 360.6 | 360.5 | 100.0 |
| 21. Lower alpine meadows | 4398.9 | 4370.6 | 99.4 |
| 22. Complex of alpine meadows, carpets, and dense-turf formations with tragacanth astragals | 1932.9 | 1919.6 | 99.3 |
| 23. Vegetation of the subnival belt | 246.7 | 245.7 | 99.6 |
| 24. Sedge bogs and wet meadows | 327.8 | 207.2 | 63.2 |
* Atlas of the Armenian Soviet Socialist Republic. Ed. Baghdasaryan A.B., Davtyan G.S., Harutyunyan A.B., Martirosyan G.M., Marukhyan A.G., Mkrtchyan S.S., Shakhbazyan M.S., Stepanyan L.A. (chairman), Urusov V.V. Academy of Sciences of the Armenian SSR. Main Directorate of Geodesy and Cartography. Yerevan – Moscow, 1961
Barseghyan A. Armenian flora. In: Armenian National Atlas, A series. 2007