1. Ներածություն՝ նախագծի նպատակը և ընդհանուր մեթոդաբանությունը
1.1. Ծրագրի նպատակը
The aim of the project is to create a Prototype of national ecosystem accounting (EA) for natural terrestrial ecosystems of Armenia in physical terms, in accordance with the System of Environmental-Economic Accounting framework (SEEA EA) (United Nations, 2021), and to provide technical recommendations for initiating physical EA in Armenia.
Նախագիծը իրականացվում է Բիոբազմազանության պահպանության կենտրոն BCC Armenia-ի և Լեյբնիցի էկոլոգիական քաղաքային և տարածաշրջանային զարգացման ինստիտուտի (IOER) համատեղ ջանքերով՝ մասնակցությամբ Ադրբեջանում առաջատար գիտական կազմակերպությունների փորձագետների։ Նախագիծը ֆինանսավորվում է Գերմանիայի Դաշնային շրջակա միջավայրի նախարարության Խորհրդատվական օժանդակության ծրագրի (AAP) կողմից՝ Կենտրոնական և Արևելյան Եվրոպայի, Կովկասի, Կենտրոնական Ասիայի և Եվրոպական Միության հարևան այլ երկրներում շրջակա միջավայրի պաշտպանության նպատակով։ Այն վերահսկվում է Բնության պահպանության դաշնային գործակալության (BfN) և Գերմանիայի Շրջակա միջավայրի գործակալության (UBA) կողմից։ Նախագիծը իրականացվում է հայերեն և անգլերեն լեզուներով։
1.2. Շրջակա միջավայրի տնտեսագիտական հաշվառման համակարգ—Էկոհամակարգային հաշվառում
(SEEA EA)
Կայուն զարգացումը անհնարին է առանց էկոհամակարգերի, դրանց մարդկանց մատուցած ծառայությունների և դրանց ենթարկվող փոփոխությունների ըմբռնման։ Այս մարտահրավերին անդրադառնում է EA-ն, որը վերջին տարիներին արագ զարգացել է։ 2024 թվականին 94 երկիր տարբեր չափով հաշվառում է իրականացրել SEEA կենտրոնական շրջանակի (SEEA CF) ներքո, իսկ 53 երկիր նաև կազմում է SEEA էկոհամակարգային հաշվառումը (SEEA EA) և/կամ թեմատիկ հաշվետվություններ։ [SEEA համաշխարհային գնահատում, 2024][1]. Մասնավորապես, INCA նախագիծը գործարկել է փորձնական EA ԵՄ երկրների համար [Եվրոպական հանձնաժողով, 2021].
EA-ն հանդիսանում է վիճակագրական շրջանակ՝ էկոհամակարգերի և էկոհամակարգային ծառայությունների վերաբերյալ տվյալների կազմակերպման և դրանց փոփոխությունների հետևման համար։ EA տվյալները անհրաժեշտ են հետևյալ առաջադրանքների համար՝ կենդանի բնության նյութական և ոչ նյութական ներդրումը մարդկանց բարեկեցությանը տեսանելի և հասկանալի դարձնելու; էկոհամակարգերի և դրանց ծառայությունների վիճակը գնահատելու և հետևելու; մարդկային գործունեության էկոհամակարգերի և դրանց ծառայությունների վրա ունեցած ազդեցությունը բացահայտելու և հետևելու; էկոհամակարգերի և էկոհամակարգային ծառայությունների պահպանման և կայուն օգտագործման նպատակով որոշումների կայացման տեղեկատվական հիմք ապահովելու:
SEEA EA-ն կառուցված է մի քանի հիմնական հաշիվների վրա (Նկ. 1-1):
1. Էկոհամակարգի չափի (EE) հաշվառումները արձանագրում են տարբեր տեսակի էկոհամակարգերի չափը և դրանում տեղի ունեցող փոփոխությունները։ Էկոհամակարգի չափը սովորաբար չափվում է տարածական մակերեսով, սակայն հնարավոր է չափել նաև երկարությամբ կամ ծավալով։ Էկոհամակարգի չափը հաշվառվում է էկոհամակարգային հաշվառման տարածքներում (EAAs)՝ օրինակ՝ երկիր, նահանգ, գետի ավազան կամ պահպանվող տարածք՝ ըստ էկոհամակարգի տեսակի։
2. Էկոհամակարգերի վիճակի հաշվետվությունները արձանագրում են էկոհամակարգերի վիճակը և դրանում տեղի ունեցող փոփոխությունները, տրամադրելով արժեքավոր տեղեկություններ էկոհամակարգերի առողջության մասին։
3. և 4. էկոհամակարգային ծառայությունների (ES) հաշիվները (ֆիզիկական և դրամային) արձանագրում են էկոհամակարգերի կողմից ES-ների մատակարարումը և տնտեսական միավորների, այդ թվում՝ տնային տնտեսությունների, կողմից այդ ES-ների օգտագործումը։
5. Ֆինանսական էկոհամակարգային ակտիվների հաշիվները արձանագրում են էկոհամակարգային ակտիվների պաշարների և դրանց փոփոխությունների մասին։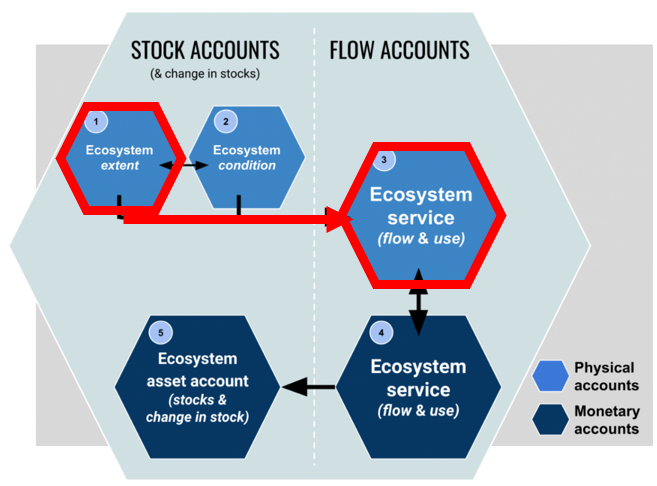
Նկ. 1-1. Էկոհամակարգային հաշիվներ և դրանց փոխկապակցվածությունը (https://seea.un.org/ecosystem-accounting). Նախագծում ընդգրկված հաշիվները ընդգծված են կարմիրով։
1.3. Էկոհամակարգային հաշվառումն Ադրբեջանում
Ներկայումս, Հայաստանը պատկանում է SEEA կենտրոնական շրջանակը կիրառող 94 երկրների շարքին և առնվազն մեկ հաշվետվություն պարբերաբար հրապարակող 67 երկրների շարքին (III փուլ)։)[2]. ինչպես ցույց է տալիս 2024 SEEA համաշխարհային գնահատում[3] Հայաստանը կազմում է ջրի հաշվեկշիռները—կոնկրետ՝ ջրի ֆիզիկական և դրամային մատակարարման և օգտագործման աղյուսակներ[4] — որոնք հրապարակվում են Հայաստանի Հանրապետության վիճակագրական կոմիտեի կայք (ԱրմՍտատ)[5]
Ինչպես նշված է SEEA-ի կայքում, 2024 թվականի դրությամբ Հայաստանը դեռ չի սկսել էկոհամակարգային հաշվարկների կազմումը։ Այնուամենայնիվ, կառավարական մակարդակում և հայ գիտական համայնքի կողմից արդեն ձեռնարկվել են էկոհամակարգային հաշվարկների անցման ուղղությամբ կարևոր քայլեր։
Այն Հայաստանի Հանրապետության կառավարության 2019 թ. ապրիլի 11-ի N 431-Ն որոշում[6] «Հայաստանի Հանրապետության հողածածկույթի դասակարգման ընթացակարգի հաստատման մասին» սահմանեց հիմնական հողածածկույթի դասերի տարածքների տարեկան հաշվառման շրջանակը՝ հիմնված համայնքներում, մարզերում (վարչական շրջաններ) և ամբողջ երկրում իրականացվող ընթացիկ հողային հաշվառման արդյունքների վրա։ Հաշվարկները պետք է կազմվեն հետևյալ հողածածկույթի դասերի համար՝ մշակվող հողեր; արոտավայրեր; ծառածածկ տարածքներ; թփածածկ տարածքներ; ջրածածկ տարածքներ; բուսածածկույթից զուրկ տարածքներ: Այդ ժամանակից ի վեր այս հողածածկույթի դասերի տարածքների վերաբերյալ վիճակագրական տվյալները հասանելի են մարզային մակարդակով և ամբողջ Արմենիայի համար (տես 2.2 բաժինը): Հողածածկույթի դասերի տարածքների տարեկան հաշվառումը էկոհամակարգերի հաշվառման ուղղությամբ հիմնարար նշանակություն ունեցող քայլ է։ Այնուամենայնիվ, էկոհամակարգերի՝ որպես կենսաբազմազանության կրիչների և էկոհամակարգային ծառայություններ մատուցողների ժամանակակից, համապարփակ հաշվառման համար անհրաժեշտ է ոչ միայն վիճակագրական աղյուսակներ, այլև թվային քարտեզներ, որոնք դեռևս առկա չեն ամբողջ Արմենիայի տարածքի համար։
Վերջին տարիներին Արմենիայի էկոհամակարգային ծառայություններին (ES) ուշադրությունը մեծացել է [Շահնազարյան, Հարությունյան, 2017], այդ թվում՝ ջրակարգավորող ES-ներ [Ներածություն…, 2011], հողի էռոզիայի կանխարգելում [GIZ EcoServe Project, 2014; 2016; Pietsch և այլն, 2019]. Այնուամենայնիվ, Արմենիայում էկոհամակարգային ծառայությունների քանակական գնահատումն ու քարտեզագրումը դեռևս չեն իրականացվել։
1.4. EA պրոտոտիպի տարբերակ 1
The EA Prototype Version 1 (EA PV1) follows the recommendations of SEEA-EA (United Nations, 2021) and the European INCA project on ecosystem accounting (Eurostat, 2024 a,b; Vallecillo et al., 2019) and covers physical EE and ES account (highlighted in red in the Figure 1.2-1). Monetary accounts are not included in the project. The EA PV1 includes statistical tables and maps presenting EE and ES indicators, as well as a short description of the main results, data sources used, the assessment methodology.
The EA PV1 was created based on currently available data – published open statistical, cartographic and scientific data for Armenia, as well as global databases. The project did not include the collection of primary data or specialized scientific research. In cases where national data is not available, the assessment was made based on global databases or expert estimates. Therefore, EA PV1 presents a simplified version of EA, including only those components that could be assessed within the project framework using available open global and national data. Nevertheless, EA PV1 demonstrates the main approaches to EE and ES accounting, including examples of accounting tables in the UN-recommended format.
Natural terrestrial ecosystems are understood as all areas excluding anthropogenic areas that are created and managed by humans — namely, built-up areas and cropland. Water bodies and aquatic ecosystems were excluded from the analysis because the factors determining their condition and dynamics differ significantly from those affecting terrestrial ecosystems. Agroecosystems on cultivated lands and ecosystems within settlements were excluded from the accounts. Yerevan was also excluded from the accounts and only marzes were involved in marz level.
EE և ES հաշվարկները կազմվել են հետևյալ էկոհամակարգային հաշվառման ոլորտների (EAA) համար:
– Ազգային և մարզային մակարդակներում՝ օգտագործելով Ինտերակտիվի միջոցով Արմենիայի ազգային և մարզային սահմանները Հայաստանի անտառային ատլաս[7] կայք;
– Հիմնական ջրբաժաններ [HydroSHEDS]
– Լանդշաֆտային գոտիներ [Հայաստանի անտառային ատլաս];
– Ծրագրի շրջանակներում պատրաստված քարտեզի (2.3 բաժին) հիման վրա բուսածածկության գոտիներ
– Մեթոդաբանական նպատակներով մենք նաև մշակել ենք Արմենիայի պաշտպանվող տարածքների (ՊՏ) համար EE և ES հաշվարկների օրինակներ (2.6 և 3.1.D բաժիններ)։
EE-ն և ES-ը քարտեզագրելու և գնահատելու համար մենք օգտագործեցինք 10 մետր լուծաչափով ESRI-ի հողածածկույթի տվյալների հավաքածու շինություններով զբաղեցված տարածքները և մշակվող հողատարածքները հաշվարկներից բացառելու, ինչպես նաև անտառային և ոչ անտառային տարածքները սահմանազատելու համար։ ESRI-ի հողածածկույթի տվյալների հավաքածուն ընտրվել է որպես EA բաղադրիչ՝ մի շարք հողածածկույթի տվյալների հավաքածուների փորձարկումներից հետո, որոնք ցույց են տվել, որ ESRI-ի տվյալները սերտորեն համընկնում են Ադրբեջանի պետական վիճակագրական տվյալների հետ գյուղատնտեսական տարածքների վերաբերյալ և թույլ են տալիս մեզ ցուցադրել էկոհամակարգի տարածքի և էկոհամակարգային ծառայությունների (ES) դինամիկան (Բաժին 2.1)։ EA պրոտոտիպի էկոհամակարգի ծավալում և էկոհամակարգային ծառայություններում (ES) փոփոխությունները հետևելու կարողությունը ցուցադրելու համար մենք ESRI-ի հողածածկույթի տվյալների հիման վրա ընտրել ենք երկու հղման տարիներ՝ 2017 և 2023 թվականները։
Տվյալների նախամշակման, EE և ES քարտեզագրման և GIS վերլուծության համար մենք օգտագործեցինք բաց կոդով QGIS հավելվածը [QGIS] և հատուկ Python սցրիպտներ։ Ջրային կարգավորող ծառայությունների գնահատման և քարտեզագրման համար մենք օգտագործեցինք InVEST GIS գործիքի մոդելները (Բաժին 3.1.A)։
Էկոհամակարգի չափը
Այս պահին Արմենիային պակասում է մանրամասն, պարբերաբար թարմացվող թվային էկոհամակարգային քարտեզ։ Ուստի՝ էկոհամակարգային հաշվառման (EE) ամենահարմար մեթոդաբանության տեղեկացված ընտրություն ապահովելու նպատակով մենք փորձարկել ենք EE հաշիվների կազմման իրագործելիությունը՝ օգտագործելով էկոհամակարգերի դասակարգման տարբեր մոտեցումներ։
– էկոհամակարգերի ամենաընդհանուր բաժանումը հողածածկույթի դասակարգերի միջոցով, այսինքն՝ հաշվի առնելով բնական հողածածկույթի դասակարգերի տարածությունը (Բաժին 2.2);
– Types of natural vegetation (Section 2.3)
– Types of natural landscapes (Section 2.4);
– Լանդշաֆտային գոտիների հողածածկույթի դասերի (LLCC) հատման կետերը որպես ցամաքային էկոհամակարգերի փոխարինիչ (Բաժին 2.5)։
SEEA EA recommends compiling national ecosystem accounts in accordance with the national ecosystem classification. Accordingly, we used the classification of landscape and vegetation zones adopted by the academic community of Armenia. Subsequently, all results can be reclassified into the SEEA-approved IUCN GET system level 3 for the purpose of international comparison (Section 2.3.A).
Աղբյուրային հողածածկույթի քարտեզները տրամադրվել էին որպես ռաստերային տվյալներ GeoTIFF ֆորմատով, իսկ կլիմայական, լանդշաֆտային և բուսածածկույթի գոտիների շերտերը մատակարարվել էին որպես վեկտորային տվյալներ GeoPackage ֆորմատով։ Այս տվյալները համադրելու համար նախ վեկտորային քարտեզները QGIS-ում ռաստերացվեցին՝ համապատասխանեցնելու հողածածկույթի ռաստերների կոորդինատային համակարգին, տարածական ընդգրկմանը և լուծաչափին, ապահովելով, որ բոլոր քարտեզները ունենան նույն պիքսելային կառուցվածքը։ Այնուհետև գոտային սահմաններով ստացված ռաստերային քարտեզները միացվեցին հողածածկույթի ռաստերային քարտեզներին երկու քայլով՝ (i) հողածածկույթի քարտեզի պիքսելային արժեքները բազմապատկվեցին 100-ով, և (ii) ստացված շտկված արժեքները գումարվեցին գոտային քարտեզի համապատասխան պիքսելային արժեքներին, ինչի արդյունքում ստացվեց միասնական ռաստեր։ Օրինակ՝ 204 վերջնական պիքսելային արժեքը նշանակում է, որ պիքսելը ունի երկու հողածածկույթային արժեք (օրինակ՝ ծառեր) և չորս լանդշաֆտային արժեք (օրինակ՝ ցածր և միջին լեռնային անտառ): Այս համակցված ռաստերը հետագայում վերլուծվել է վեկտորային շերտով, որը պարունակում էր մարզերի ջրբաժանների սահմանները: QGIS-ի Zonal Histogram գործիքը կիրառվեց՝ հաշվարկելու յուրաքանչյուր եզակի ռաստերային արժեքի հանդիպումների քանակը մարզերի կամ ջրբաժանների բազմանկյունային գոտիներում։ Արդյունքային շերտը, որը պարունակում էր յուրաքանչյուր մարզի կամ ջրբաժանի ներսում եզակի ռաստերային արժեք ունեցող պիքսելների քանակի վիճակագրություն, արտահանվեց աղյուսակային ֆորմատով հետագա վիճակագրական վերլուծության համար։
Տարածքը հաշվարկվել է միջին 100 մ² պիքսելի չափի հիման վրա։ Երկրի ընդհանուր մակերեսի և հողածածկույթի տվյալներից ստացված մարզերի մակերեսների միջև անհամապատասխությունը պայմանավորված է օգտագործված թվային քարտեզների սահմանների անհամապատասխանություններով, ինչպես նաև ամբողջ Արմենիայում տեղանքի բազմազանության պատճառով պիքսելների մակերեսի հաշվի չառնված փոփոխություններով։ Այս անհամապատասխանությունները պետք է լուծվեն Արմենիայում ազգային էկոհամակարգի տարածքի հաշվարկման համակարգի մշակման ընթացքում։
SEEA EA-ն առաջարկում է էկոհամակարգի տարածքի տարեկան հաշվառում։ Սակայն, ըստ Հայաստանի Հանրապետության կառավարության 2019 թ. ապրիլի 11-ի N 431-Ն որոշումՏարեկան տվյալների հավաքագրումը ներկայումս սահմանված է միայն հողածածկույթի դասերի տարածքների վիճակագրության համար, առանց հանրային մատչելի թվային քարտեզների (տես Բաժին 2.2.A): Ուստի մեթոդաբանական նպատակներով՝ և EA-ի էկոհամակարգային դինամիկան հետևելու կարողությունը ցուցադրելու համար՝ մենք օգտագործել ենք ESRI Land Cover տվյալները 2017 և 2023 թվականների համար:
Նաև տվյալների պակասի պատճառով մենք ամբողջությամբ չկարողացանք հետևել SEEA-EA-ի առաջարկություններին՝ էկոհամակարգի տարածքի փոփոխությունները կառավարվող և ոչ կառավարվող բաժանելու համար։ Այնուամենայնիվ, ESRI-ի հողածածկույթի տվյալներով հայտնաբերված հողածածկույթի փոփոխությունների զգալի մասի՝ մասնավորապես մշակվող հողերի և կառուցված տարածքների ընդլայնման դեպքում ակնհայտ է, որ դրանք կառավարվող փոփոխություններ են։ Ուստի վերջնական հաշվարկային աղյուսակներում այս շարժիչ ուժը նշված է այդ դեպքերի համար; մյուս դեպքերում շարժիչ ուժը նշվում է որպես «չորոշված»:
Մարզերի համար տնտեսական միավորներով EE հաշիվը կազմվել է։
Transition matrices (change matrices) were produced on the base of GIS-analysis for both land-cover classes and vegetation types. The land-cover class matrix directly captures class-to-class transitions between the ESRI 2017 and 2023 datasets. The vegetation-type transition matrix also shows how areas of vegetation zones transited into land-cover classes (e.g., steppe vegetation converting to croplands, built-up, bare ground, or tree cover, and vice versa). Zone-to-zone vegetation transitions are not recorded in EA PV1, because the zone boundaries did not change.
Էկոհամակարգային ծառայություններ
SEEA-EA-ում [ՄԱԿ, 2024] էկոհամակարգային ծառայությունները (ES) հասկացվում են որպես էկոհամակարգերի ներդրում տնտեսական և այլ մարդկային գործունեություններում օգտագործվող օգուտներում։ Վերջնական էկոհամակարգային ծառայությունները (Final ES) այնպիսի ծառայություններն են, որոնց սպառողը տնտեսական միավոր է. հետևաբար, յուրաքանչյուր վերջնական ES ներկայացնում է հոսք էկոհամակարգային ակտիվի և տնտեսական միավորի միջև։ Միջանկյալ էկոհամակարգային ծառայությունները (Intermediate ES) այնպիսի ծառայություններն են, որոնց սպառողը էկոհամակարգային ակտիվն է և որոնք կապված են վերջնական ES-ների մատակարարման հետ։ Շահերը այն ապրանքներն ու ծառայություններն են, որոնք վերջնական օգտագործվում և վայելվում են մարդկանց և հասարակության կողմից։ Էկոհամակարգային հաշվառման մեջ կիրառվելիս շահը արտացոլում է բարեկեցության աճը կամ դրական ներդրումը, որը առաջանում է էկոհամակարգային ծառայությունների օգտագործումից։
The EA PV1 accounts for 13 final ES across all final ES categories: provisioning, regulating, recreational and intangible (Table 1.4-1). We did not consider intermediate ES. The full list of ES mentioned in SEEA–EA is presented in Table 1.4-2.
Table 1.4-1. List of ES asessed in the EA PV1
The EA PV1 focuses on the natural conditions and processes underpinning ES provision, while excluding societal factors of ES supply and use, ecosystem management and other labor and resource inputs associated with ES supply and use, ES import-export, as well as ES contributions to the System of National Accounts.
The SEEA EA terminology concerning ES volume provided by ecosystems differs slightly from that commonly used in literature. In much of the ES literature, the term supply is used to refer to an ecosystem’s potential or capacity to supply ES irrespective of use. In the SEEA-EA framework, ES physical accounts record the supply of ES by ecosystems and the use of ES by economic units (businesses, governments and households). ES are recorded as flows between ecosystem assets and economic units. The measures of supply and use are equivalent and will be equal to the actual flow between the ecosystem asset and people. In other words, the total volume of ES supplied by different ecosystems equals the total volume of ES used by different users. These indicators show how ES produced by different ecosystems are redistributed among different users. However, they do not reveal management-relevant aspects — such as the degree of ES use (including overuse and the potential to scale up use), or the extent to which the existing ES flow meets demand. These aspects can be assessed on the base of ecosystem potential to provide ES (capacity) which is understood as the ability of an ecosystem to generate an ES at the highest yield or use level that does not negatively affect the future supply of the same or other ES from that ecosystem. SEEA EA proposes keeping separate accounts for ecosystem capacity. INCA project proposes to include in accounting tables indicators of ES potential (capacity), ES demand, actual ES flow which is equal to ES supply-use, and unmet demand (Vallecillo et al., 2019).
Given the pivotal importance of the ecosystem potential (capacity) indicator for ecosystem management, we adopted it in PV 1 as the primary basis for ES assessment. Ecosystem potential can be evaluated from natural factors and the biological characteristics of ecosystems. Such data were available for all 12 ES assessed quantitatively or by scoring (the exception is the ES “biodiversity value for Armenia’s culture,” which we only described with examples). The ecosystem potential (capacity) is relevant both for ES that can be overused (provisioning and recreational services) and for regulating ES, which cannot be directly overused but may be insufficient to meet human demand. The capacity was assessed for the remaining 12 ES (Table 1.4-2).
Table 1.4-2. List of ES from SEEA EA, with those included in the EA PV1 highlighted in bold italics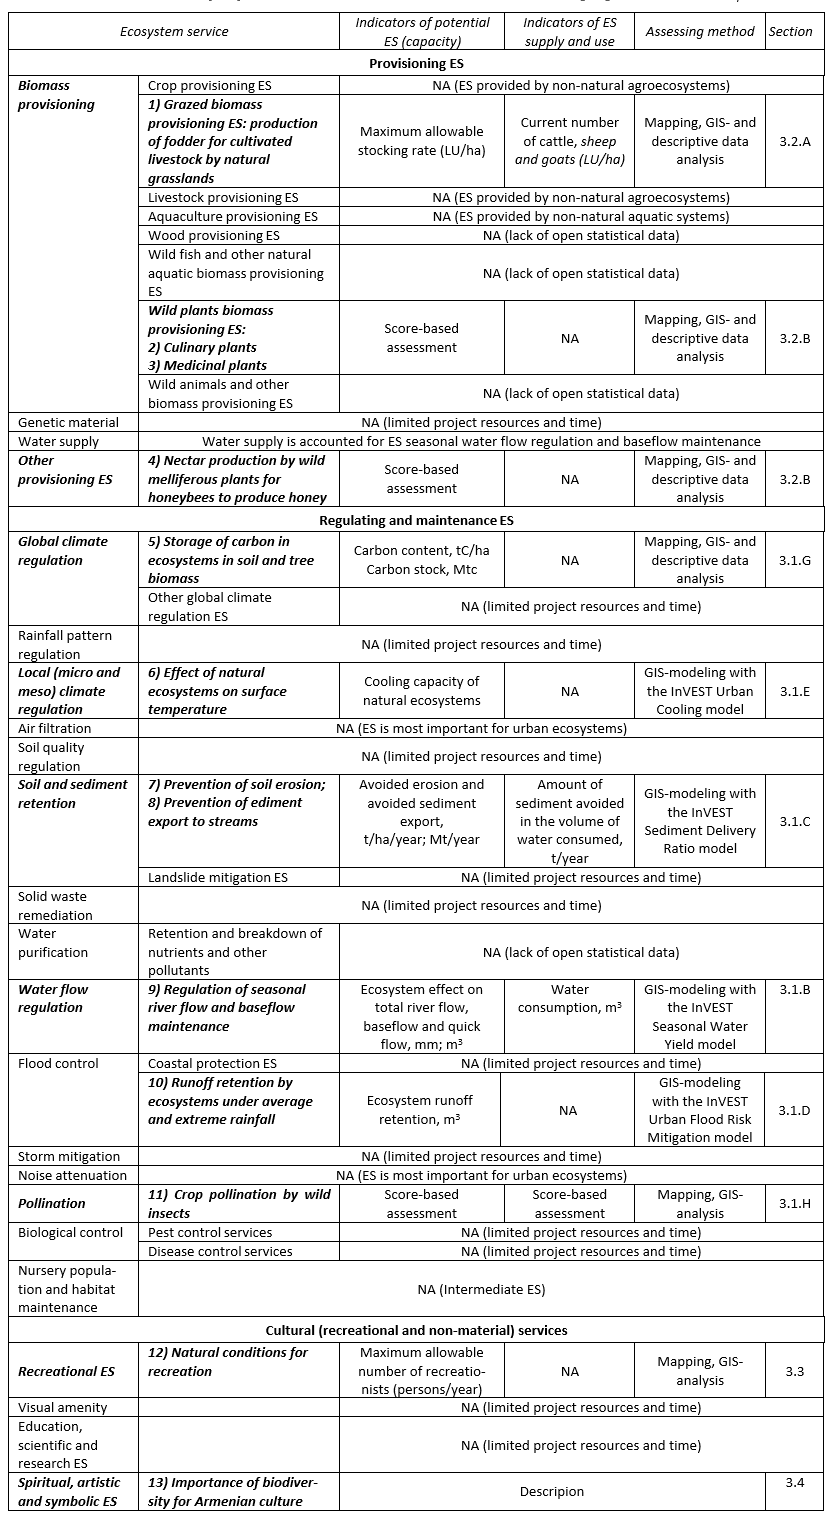
The assessment of ES use requires socio-economic data, which was available for only six ES. In four cases the ES users (economic units) were the marzes for the grazed biomass production ES (ES 1 in Table 1-1), two water-regulating ES (ES 8 and 9), and pollination (ES 11); in one case—settlements for the ecosystems’ cooling effect (ES 6); and in one case—Protected Areas for the ES of natural conditions for hiking in PAs (ES 12). Benefits derived from assessed ES are described in Table 1.4-3.
Table 1.4-3. Initial logic chains for assessed ES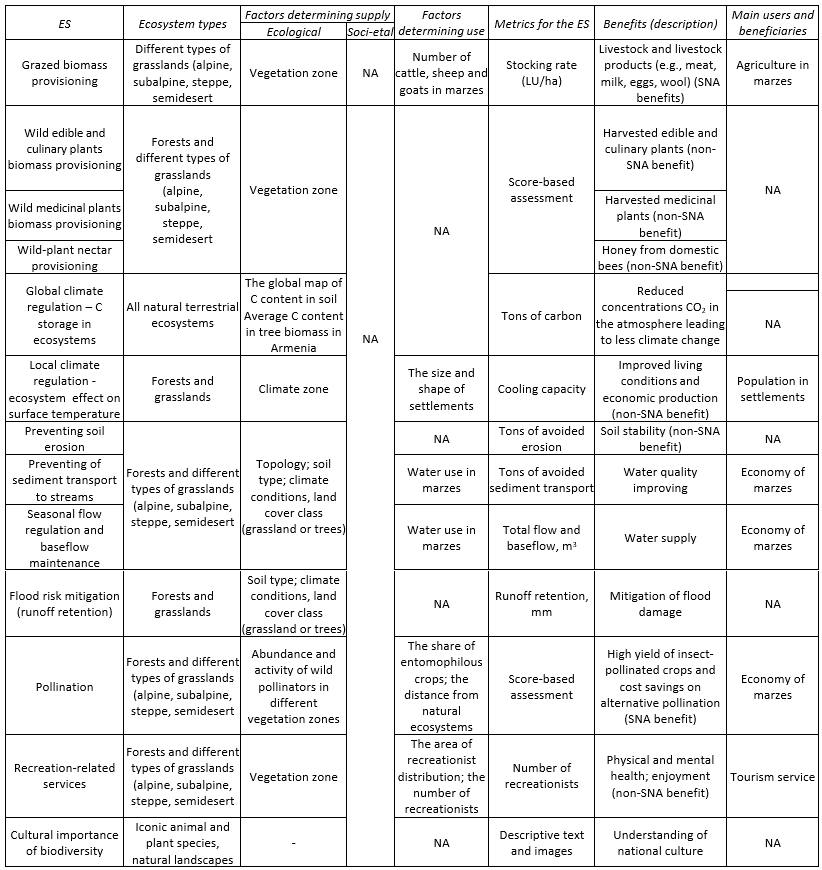
Changes in ES were assessed only in terms of their potential/capacity, based on land-cover changes between 2017 and 2023. The effects of climate change were not taken into account. An assessment of changes in ES use and supply was not conducted because data on ES use for 2017 are unavailable.
To determine ES volume provided by ecosystems, we proceeded from the following understanding of baseline conditions — situations in which ecosystems are absent and ES is not performed (Table 1.4-4). For most ES, it was assumed that in the absence of ecosystems ES would be entirely absent (no/zero ES). For water-related regulating ES, which are partly performed by the bare land surface without living cover, the baseline conditions were represented by a “bare ground” scenario, where all natural ecosystems were replaced with bare ground (see Section 3.1.A).
Table 1.4-4 Baselines for assessed ES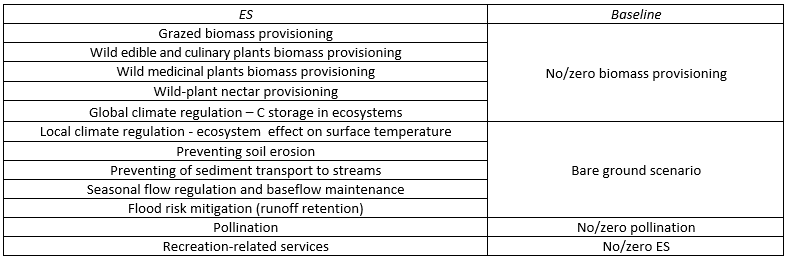
Changes in ES were assessed using two approaches:
– for ES modelled in InVEST, changes were calculated as differences between ES indicator values derived from maps based on land cover data for 2017 and 2023;
– for all ES, indicators were first assigned to each ecosystem type, after which changes in total ES values at the marz and national levels were estimated based on changes in the extent of land cover classes (Section 2.2.B) and ecosystems (Section 2.3.C) between 2017 and 2023.